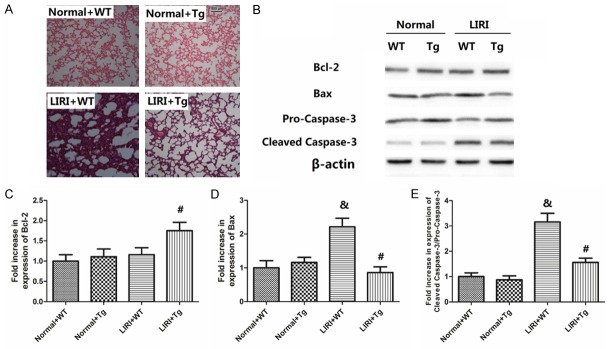
Figure 1.
Histopathological changes and apoptotic protein expression. Microscopic examinations of the lung tissues were stained with hematoxylin and eosin was shown in (A. The magnification used in these photos was 200 ×. LIRI: lung ischemia/reperfusion injury; Tg: transgenic mice of HSP70; Vehicle: mice treated with saline. Apoptotic protein expression (Bcl-2, Bax, pro-caspase-3 and cleaved caspase-3) is shown in (B-E). Values are expressed as Mean ± SEM. &P<0.05 compared to Sham+WT; #P<0.05 compared to LIRI+WT. N = 8 per group.

