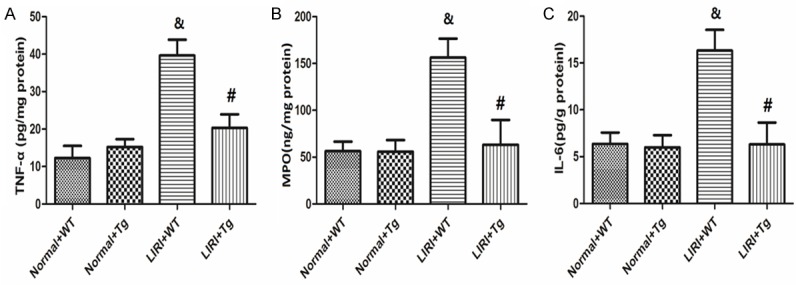
Figure 3.

Changes in lung inflammation markers (TNF-α, MPO and IL-6). The levels of TNF-α, MPO and IL-6 levels in the lung tissues are shown in (A-C), respectively. Values are expressed as Mean ± SEM. &P<0.05 compared to the Sham+WT; #P<0.05 compared to the LIRI+WT. N = 10 per group.
