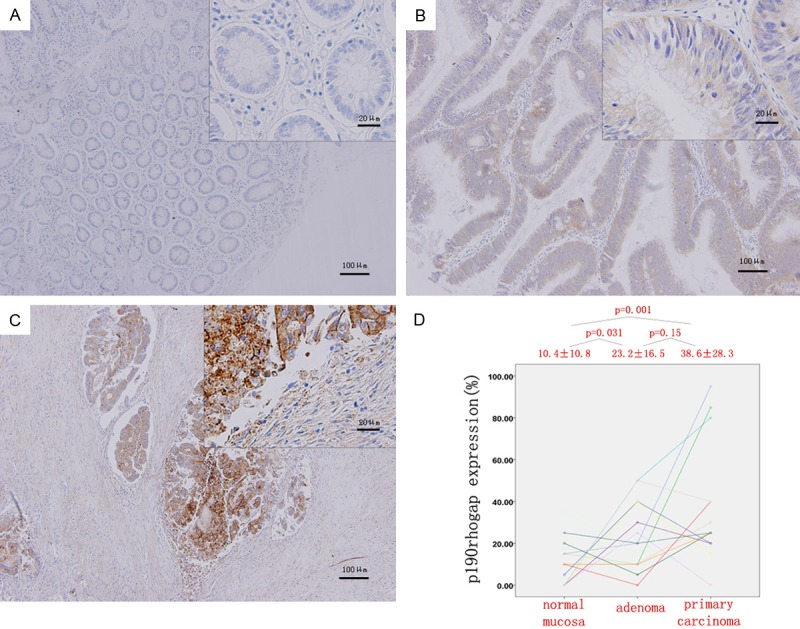
Figure 2.

Quantitative analysis of the IHC staining in CRC. (A-C) p190rhogap staining was localized within the cytoplasm of colorectal epithelial cells. (D) The p190rhogap expression increased significantly from normal mucosa (A) to adenomas (B) and from normal mucosa (A) to carcinomas (C) though no significantly up-regulation from adenomatous (B) to cancerous (C) tissue. Magnification, 100× and 400×.
