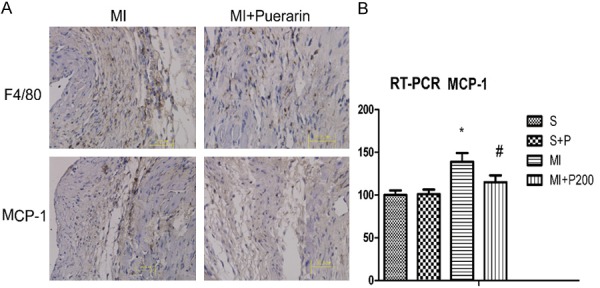
Figure 3.

A. Micrograph of MCP-1 and F4/80 immunohistochemical staining in the MI (left panel) and MI plus high dose puerarin treatment (right panel). B. Real-time qPCR quantification of MCP-1. All data are shown as means ± SD and experiments were repeated three times. #P < 0.05 VS MI, *P< 0.05 VS sham group, n=5.
