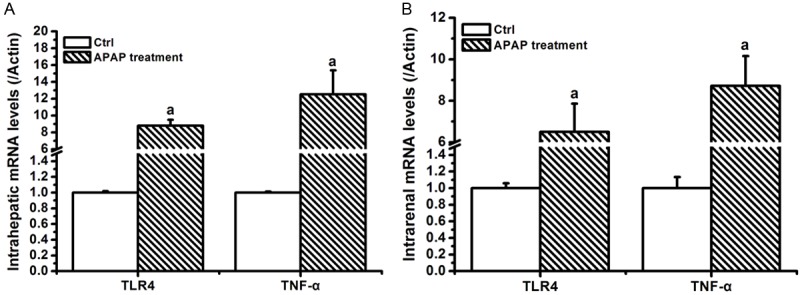
Figure 3.

APAP affected inflammation-related mRNAs in liver and kidney samples. Statistical data was analyzed by using SPSS 19.0 software. Differences between two-compared groups were assessed by a one-way analysis of variance (ANOVA) followed by Student’s t-test. Result was expressed as mean ± SD. Notes: vs. Control (ctrl), a P<0.05.
