
Figure 3.
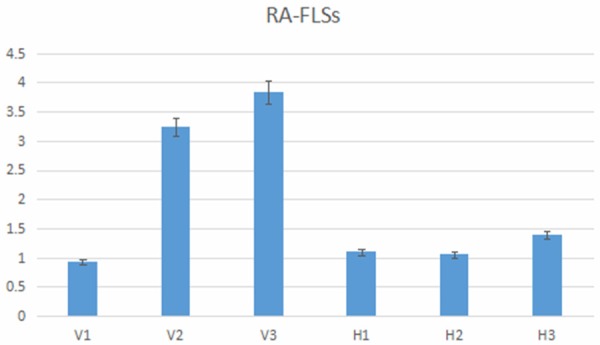
Cell proliferation in different groups. Histogram of the MTT assay shows that the proliferation rate of hydrogen and H2O2 was decreased compared with H2O2. With the extension of processing time, the H2O2 groups in the proliferating cells of the H2O2 and hydrogen group had no significant difference. (V represented H2O2 group, H represented H2O2 and hydrogen group, 1 represented 24 h, 2 represented 48 h and 3 represented 72 h).