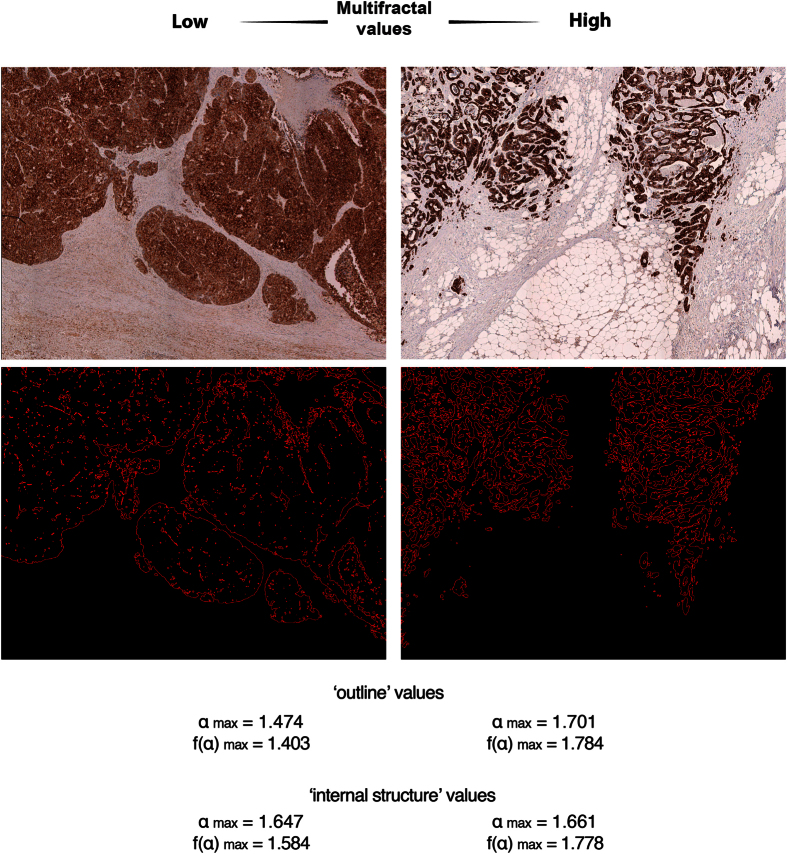
Figure 1. Representative images from cases with low and high MF metrics scores.
Two tumors are shown after pan-cytokeratin staining and after completion of “contour-formation”. Cases are selected to illustrate low and high MF metrics scores. αmax and f(α)max scores are shown as for ‘outline’-based and ‘internal structure’-bases image analyses.

