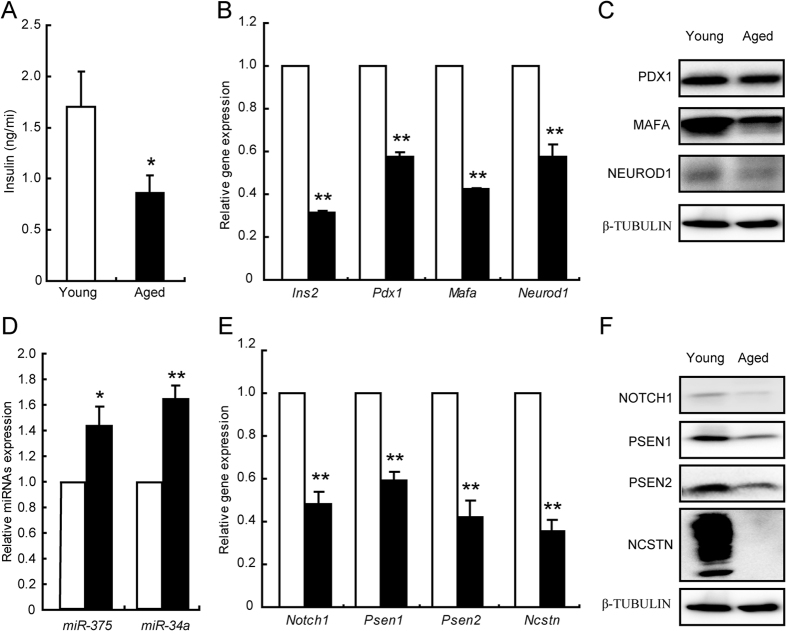
Figure 7. Alterations of genes and miRNAs in aged Wistar rats.
Plasma insulin levels in young rats (white bar, control) and aged rats (black bar) (A). mRNA (B) and protein (C) levels of genes specific in beta cells were examined in islets isolated from young rats (white bar, control) and aged rats (black bar). miR-375 and miR-34a expression levels (D). mRNA (E) and protein (F) levels of NOTCH1 and components of γ-secretase. Data shown are means ± SEM. *p < 0.05 or **p < 0.01 vs. control. n = 6 per group.

