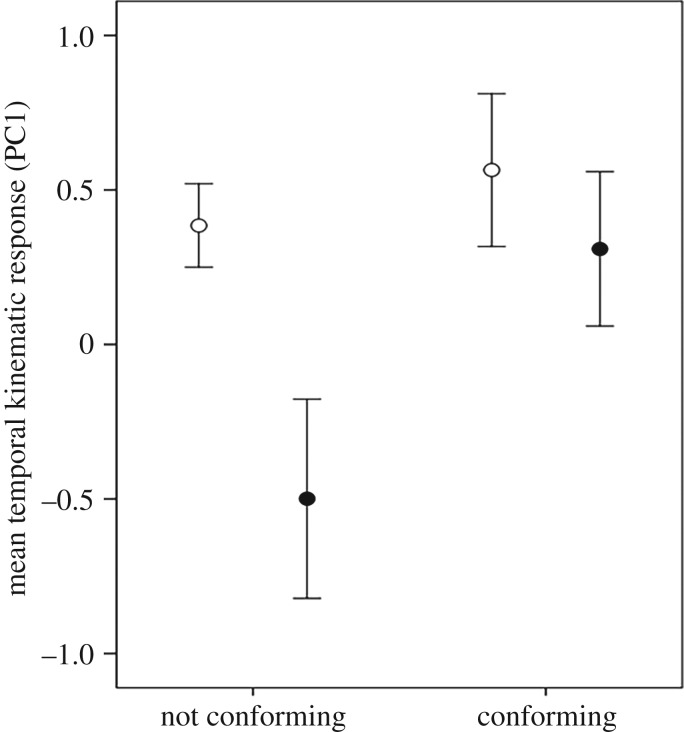
Figure 6.
Mean (±s.e.) synthetic temporal kinematic performance response of fish exposed, in groups of 20, to 4 days of low- (open circle) or high- (filled circle) risk conditions. Fish were determined to conform or not conform to the majority of fish in their schools, based on the bias of the fish compared with the bias of the school (fish and school without bias were excluded from the analysis). Kinematic performance scores were derived from the first axis of a PCA (53% variance explained) encompassing four kinematic variables (n = 5–15 treatment−1).

