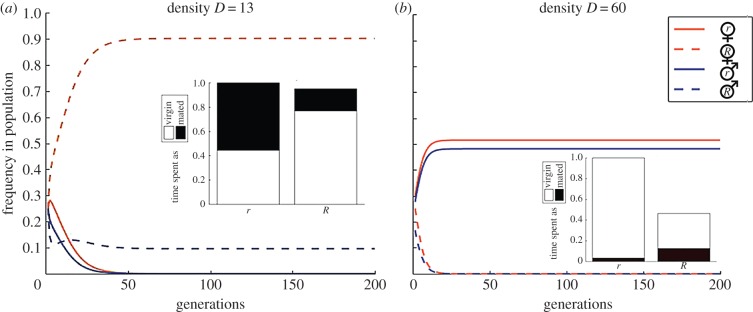
Figure 1.
The frequency of each type in the population over 200 generations at two densities (a) D = 13 and (b) D = 60. The embedded barplots show the expected lifespans of R and r females and the proportions that they spend in the virgin state at the given population densities at equilibrium. Other parameters: θ = 5, α = 0.01, β = 1, and the initial frequency of R is 0.5. (Online version in colour.)

