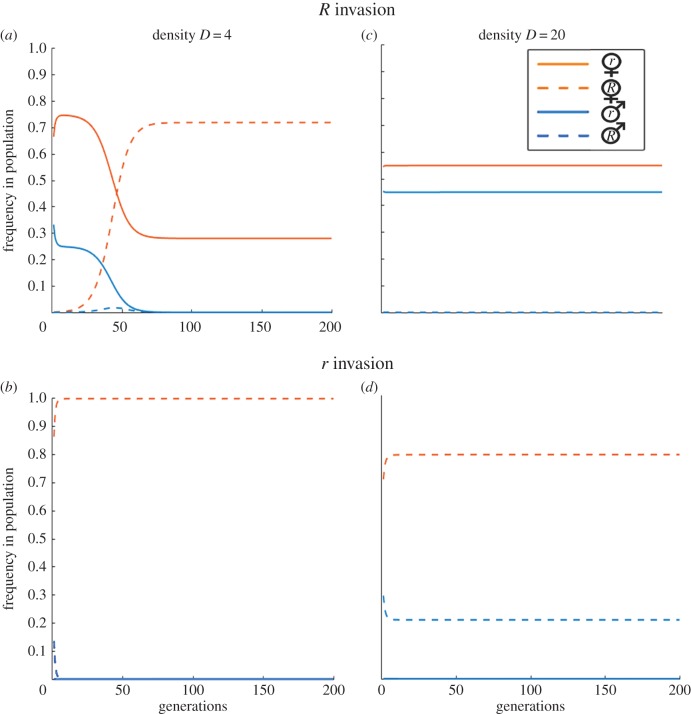
Figure 2.
The impact of initial frequency on the evolution of resistance and the demographic consequences. The composition of the population is shown for 200 generations at densities D = 4 (a,b) and D = 20 (c,d), starting from an initial frequency of R of either 0.001 (a,c) or 0.999 (b,d). Other parameters: θ = 5, α = 0.01, β = 1. (Online version in colour.)

