Figure 2.
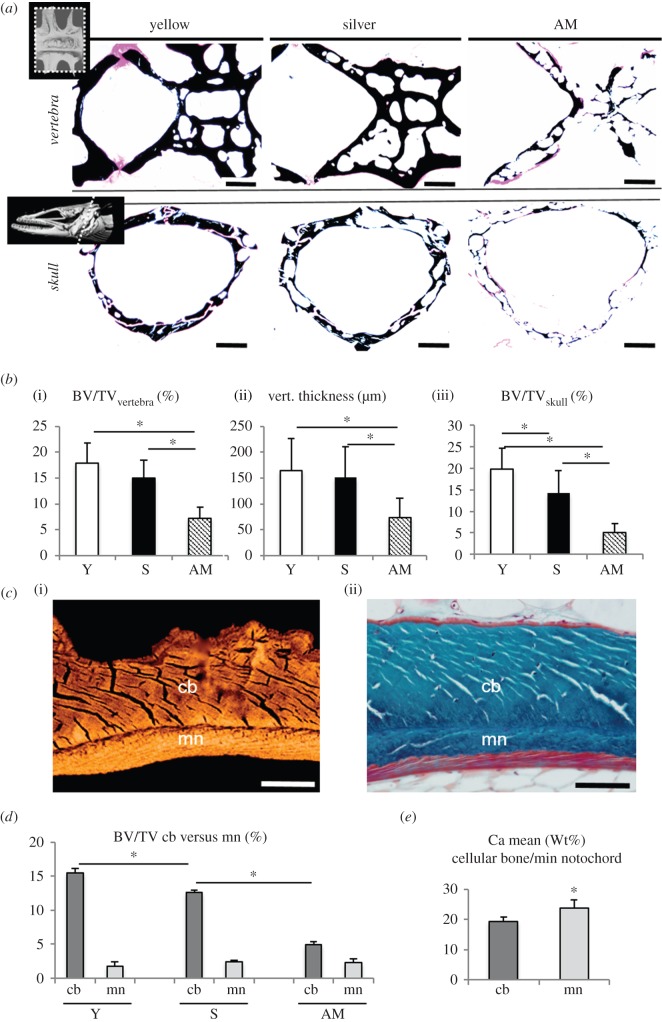
Massive bone loss during maturation. (a) Images of von Kossa-stained sections show the bone loss during maturation in the vertebra (above) and skull base (below). Scale bar, 200 µm. (b) Bar graphs indicate decreasing bone volume per tissue volume (BV/TV) in the (i) vertebra and (iii) skull, as well as decreasing (ii) thickness of the vertebral endplates. (c) Higher magnification reveals that vertebral bone is divided into two compartments. There are two types of mineralized tissue: cellular (osteocytic) bone (cb) and a mineralized notochord sheath (mn), (i) image obtained by qBEI and (ii) trichrome Goldner staining. Scale bar, 50 µm. (d) Quantification of osteocytic bone and acellular notochord bone separately showed that only osteocytic bone was resorbed, whereas the mineralized notochord sheath persists in artificially matured eels. * denotes the significant decrease of cellular bone among the groups. (e) The mineralized part of the notochord shows higher mineralization (Ca mean) than the cellular bone when measured separately. *p < 0.05.

