Figure 4.
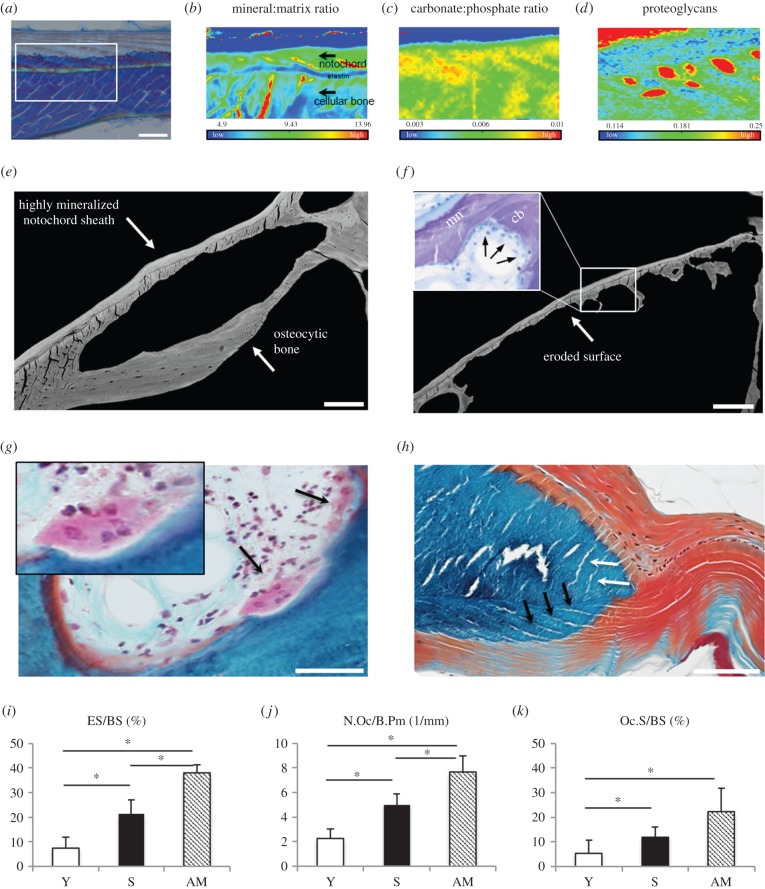
(a–d) Fourier transform infrared (FTIR) spectroscopy in the eel's vertebral endplates. (a) Toluidine blue staining signifies the scanning area for FTIR. Scale bar, 50 µm. (b) The mineral : matrix ratio was higher in the mineralized notochord sheath. Note the prominent non-mineralized elastin layer in between the cellular bone and the notochord. (c) The increased carbonate : phosphate ratio is either due to higher carbonate or lower phosphate contents in the mineralized notochord compared with the cellular bone. (d) The proteoglycan content was substantially lower in the mineralized notochord sheath, which reveals that its structural composition is different from the cellular bone matrix (red patches are due to cutting artefacts). (e–k) Mechanism of osteoclastic resorption. (e) The qBEI of a silver eel in higher magnification shows mineralized notochord and cellular bone where only cellular bone can be resorbed. Scale bar, 100 µm. (f) Hormone-treated eels present large eroded surfaces. The cellular bone was almost completely resorbed. Scale bar, 100 µm. (g) Histology of a trichrome Goldner stained specimen shows multinucleated osteoclasts in Howship's lacuna. Scale bar, 50 µm. (h) Fibres of the enlarged notochord sheath in the intervertebral space continue in the mineralized part of the sheath (black arrows). In the outer bone layer there are equivalent structures that have been identified as Sharpey's fibres (white arrows). Scale bar, 100 µm. (i–k) Resorption parameters such as eroded surface per bone surface (ES/BS), number of osteoclasts per bone perimeter (N.Oc./B.Pm), and osteoclast surface per bone surface (Oc.S/BS) increased significantly among the groups. *p < 0.05.

