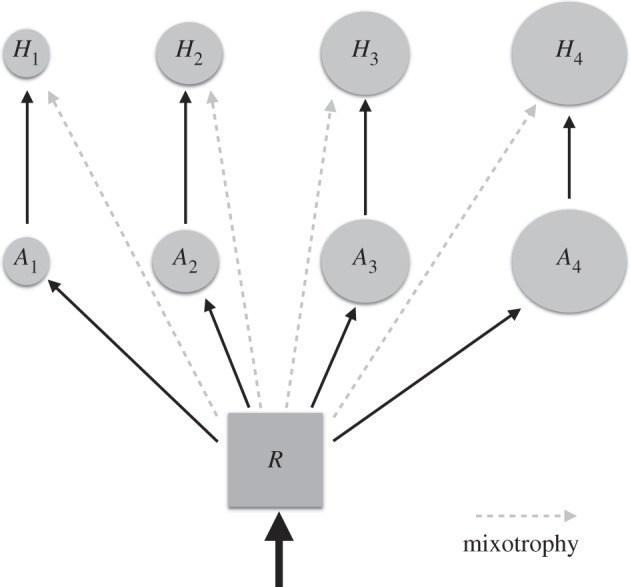
Figure 3.

Schematic depiction of the simplified model employed here. A single inorganic resource, R, sustains an assemblage of photoautotrophs (Ai) each of which is consumed by a specific predator (Hi). Cell volume/body size increases with index i. Solid black lines indicate the flow of resource in the purely specialist (autotroph/heterotroph) model. Dashed grey lines indicate the additional flows when mixotrophy is introduced into the model.
