Figure 2.

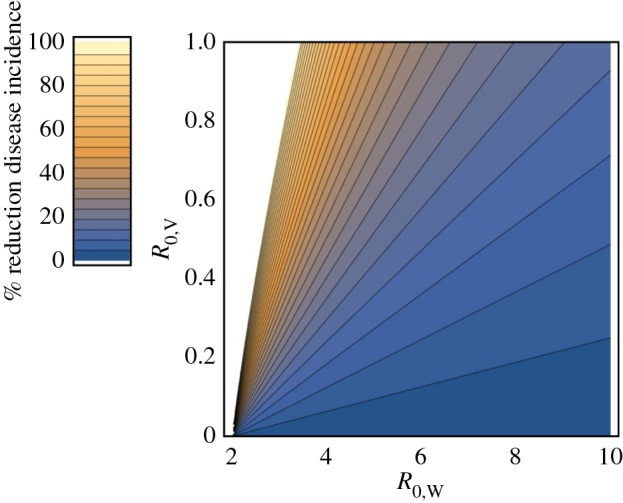
The fractional reduction in abundance of disease infected hosts (W) as a function of vaccine and disease R0. The direct vaccination rate was set at σ = 0.5 in this figure. Areas shown in white result in disease eradication.

The fractional reduction in abundance of disease infected hosts (W) as a function of vaccine and disease R0. The direct vaccination rate was set at σ = 0.5 in this figure. Areas shown in white result in disease eradication.