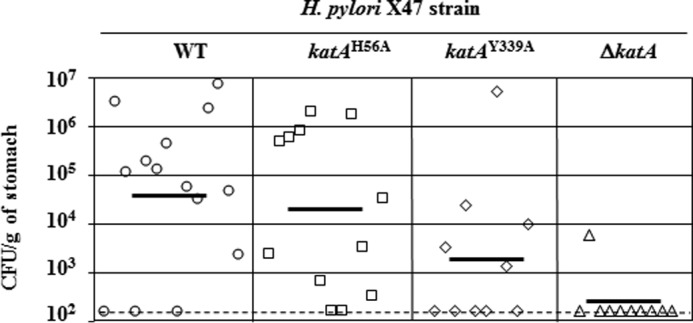
FIGURE 5.

Mouse colonization by H. pylori X47 (parent) and X47 katA strains. Mice were inoculated with a dose of 1.5 × 10⁸ viable cells. Colonization of the mouse stomachs was determined 3 weeks post-inoculation. Mouse stomachs were homogenized, and serial dilutions were plated. Data are presented as a scatter plot of numbers of CFU/g of stomach (log10 scale) as determined by plate counts. Each symbol represents the mean CFU count for one stomach (n = 14 for WT, n = 12 for katAH56A, n = 10 for katAY339A, and n = 10 for ΔkatA, respectively). Each horizontal bar represents the geometric mean of the colonization load for each group. The ΔkatA mutant (catalase null strain) geometric mean is significantly lower than the wild-type strain (p < 0.01, Student's t test), or the katAH56A mutant (p < 0.01), or the katAY339A mutant (p < 0.08), while there is no significant difference between average colonization loads (geometric mean) for WT, katAH56A, and katAY339A strains (p < 0.01). A dashed horizontal line shows the detection limit, which represents a count below 1.5 × 10² CFU/g of stomach.
