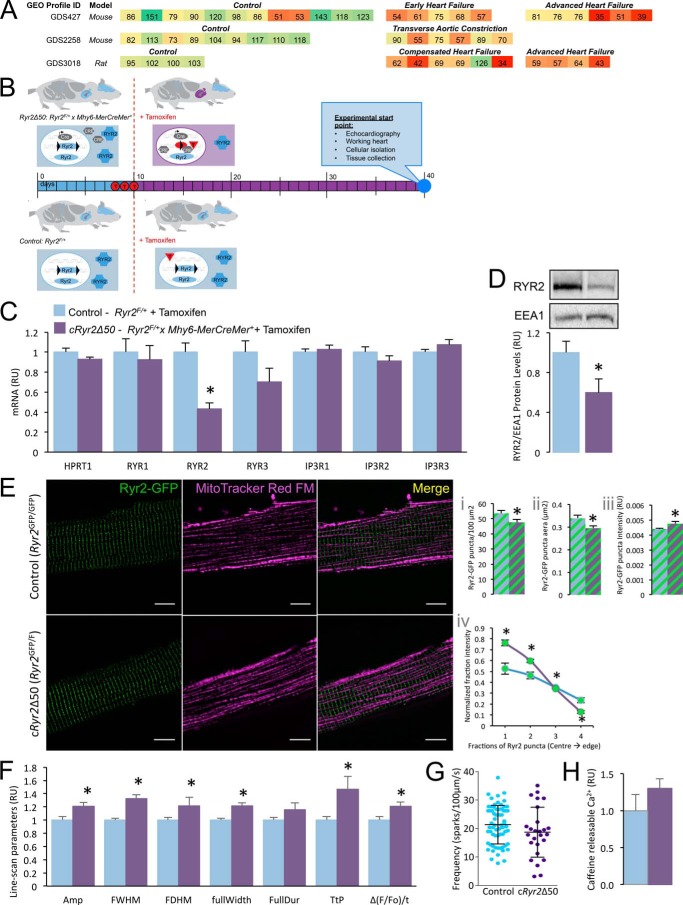
FIGURE 1.
Generation of an inducible, heart-specific, partial Ryr2 ablation model (Ryr2Δ50). A, selected Ryr2 transcriptomics data from NCBI GEO were re-normalized to the average of their control values and presented as a heat map. B, breeding scheme, experimental design, and analysis timeline. C, cRyr2Δ50 cardiomyocytes have a specific reduction in Ryr2 mRNA, and no compensation from other known endoplasmic reticulum (ER)/SR Ca2+ channels (n = 4–8, *, p ≤ 0.05). Blue bars = control (Ryr2flox/wildtype + tamoxifen), purple bars = cRyr2kΔ50 (Ryr2flox/wildtype × Mhy6-MerCreMer+ + tamoxifen) throughout. D, cardiac RYR2 protein levels in cRyr2Δ50 mice 3 weeks after tamoxifen (n = 7, *, p ≤ 0.05). E, images of Ryr2-GFP fusion proteins in isolated cardiomyocytes from control (Ryr2GFP/GFP) and cRyr2Δ50 (Ryr2GFP/flox × Mhy6-MerCreMer + tamoxifen) mice (n = 9 cells/group; scale bar, 10 μm). Images were quantified for Ryr2-GFP puncta number (panel i), area (panel ii), and intensity (panel iii). A measure of puncta intensity distribution (mean fractional brightness from the center to the edge of the puncta) was also quantified (panel iv). *, p ≤ 0.05. F, line-scanning spark measurement parameters of cRyr2Δ50 cardiomyocytes (control n = 70, cRyr2Δ50 n = 26; data from three cell isolations, *, p ≤ 0.05) Amp, amplitude; FWHM, full width at half maximum; FDHM, full duration at half maximum; fullWidth, full width; FullDur, full duration; TtP, time to peak. G, spark frequency in isolated cRyr2Δ50 cardiomyocytes (control n = 70, cRyr2Δ50 n = 26; data from three cell isolations). H, peak Fluo-4 intensity following 3 mm caffeine treatment of control (n = 5) and cRyr2Δ50 cardiomyocytes (n = 6). All data were plotted as mean ± S.E.

