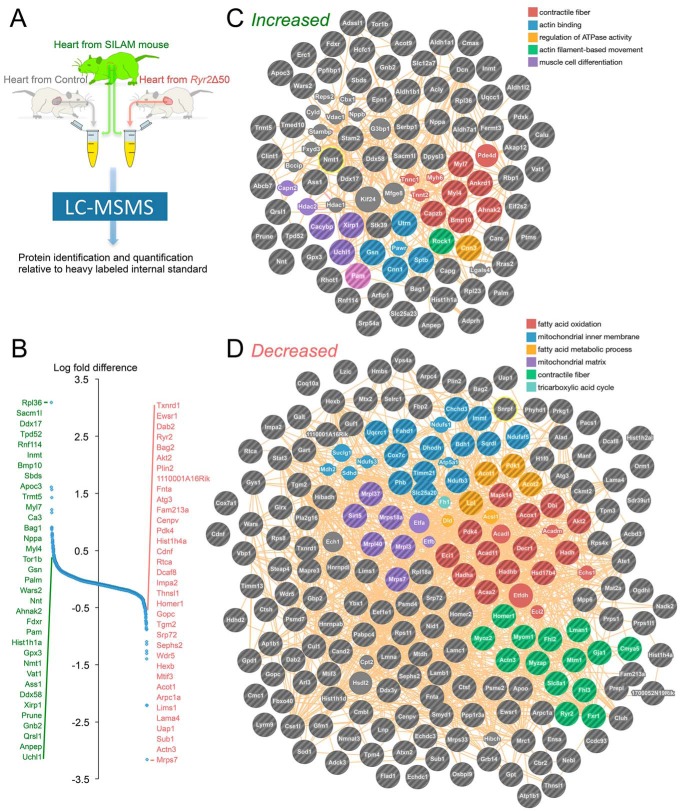
FIGURE 5.
Proteomic analysis of cRyr2Δ50 hearts. A, schematic depicting the experimental design of the proteomics experiment, including spike-in with stable isotope-labeled heart tissue (SILAM hearts) to enable quantitative normalization. Four mice per treatment group were pooled and analyzed simultaneously by mass spectroscopy. B, distribution of relative protein abundance measurements, with the 25 most enriched proteins (green) and 25 most depleted proteins (red) between treatment groups listed. C and D, analysis of up-regulated (C) and down-regulated (D) proteins identified significantly enriched networks (false discovery rate < 0.05).

