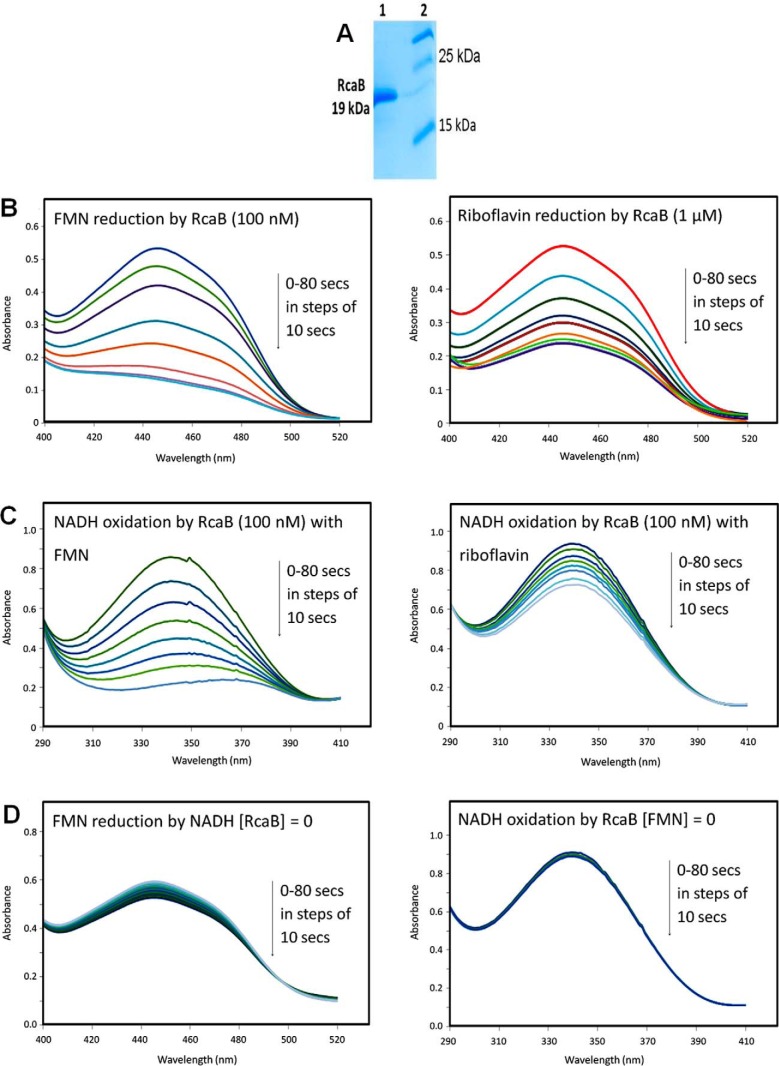
FIGURE 4.
Biochemical characterization of RcaB. A, SDS-PAGE analysis of RcaB after purification on a maltose-binding column followed by maltose tag cleavage. Lane 1, purified RcaB; lane 2, molecular mass markers; B, left trace, UV-visible spectrum at 450 nm of the reduction of FMN with NADH and 100 nm RcaB; right trace, UV-visible spectrum at 450 nm of the reduction of riboflavin with NADH and 1 μm RcaB C, UV-visible spectrum at 340 nm of the RcaB (100 nm)-catalyzed oxidation of NADH with FMN (left trace) and riboflavin (right trace); D, left trace, UV-visible spectra of the non-enzymatic reduction of FMN with NADH; right trace, UV-visible spectra of the RcaB-catalyzed oxidation of NADH in the absence of flavin.

