FIGURE 6.
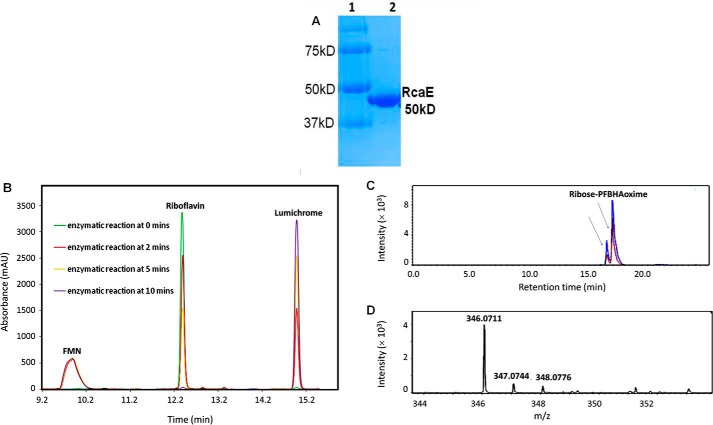
Biochemical characterization of RcaE. A, SDS-PAGE analysis of RcaE purified on a Ni-NTA HisTrap column. Lane 1, molecular mass markers. Lane 2, purified RcaE. B, HPLC trace of the RcaA, RcaB, RcaE-catalyzed reaction of riboflavin with NADH and ATP showing time-dependent formation of lumichrome. C, extracted ion chromatogram (EIC) of the full reaction, after derivatization with PFBHA, showing EIC at 346.0708 corresponding to the formation of the E and Z isomers (indicated by black arrows) of ribose-PFBHA oxime (M+H+ 346.0708) (red trace). Co-elution of the ribose-PFBHA oxime from the full reaction with synthesized standard of ribose-PFBHA oxime (blue trace). D, ESI-mass spectrum in the positive mode of the reaction product, ribose-PFBHA oxime. The protonated mass (M+H+) is observed at 346.0711 Da with 0.8 ppm mass error.

