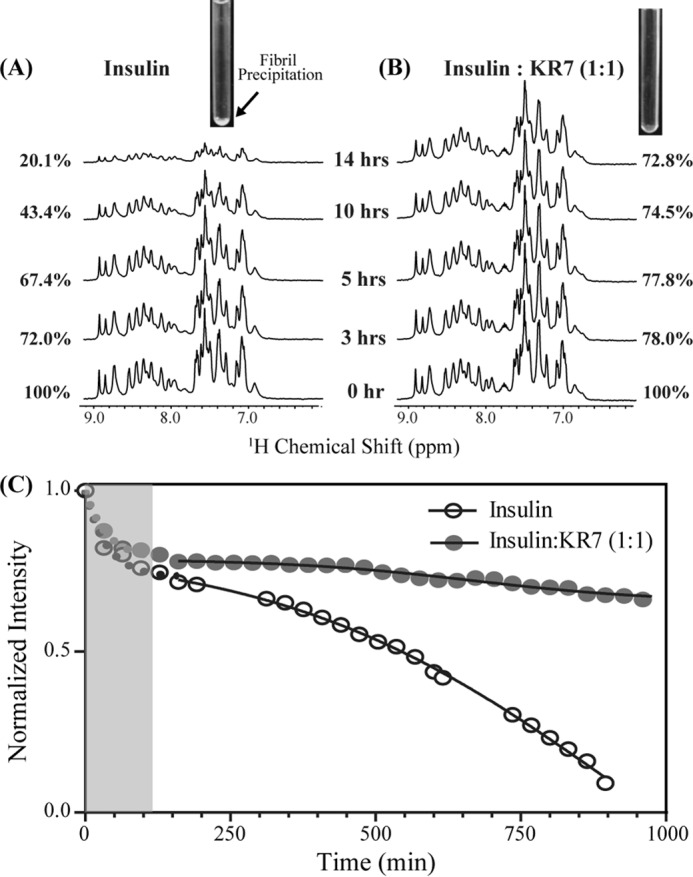
FIGURE 2.

One-dimensional 1H NMR time-course of insulin at 335 K in the presence and absence of KR7 peptide. Conditions were similar to those used in the ThT experiment: 2 mg/ml insulin in 50 mm citrate phosphate buffer with 100 mm NaCl (pH 2.6). A, one-dimensional 1H NMR of the aromatic and amide region of insulin alone. Inset, image of the NMR tube at the end of the experiment. A precipitate is visible at the bottom of the tube. B, one-dimensional 1H NMR of aromatic and amide region of insulin in the presence of KR7 at 1:1 molar ratio. Inset, image of the NMR tube at the end of the experiment. No precipitate is visible at the bottom of the tube. C, time course of the integrated intensity. The data were fit to a two part model consisting of an exponential first stage (shaded region) and a sigmoidal second stage (solid line). KR7 has little effect on the initial phase in the lag phase of the ThT data but a strong effect on the latter phase.
