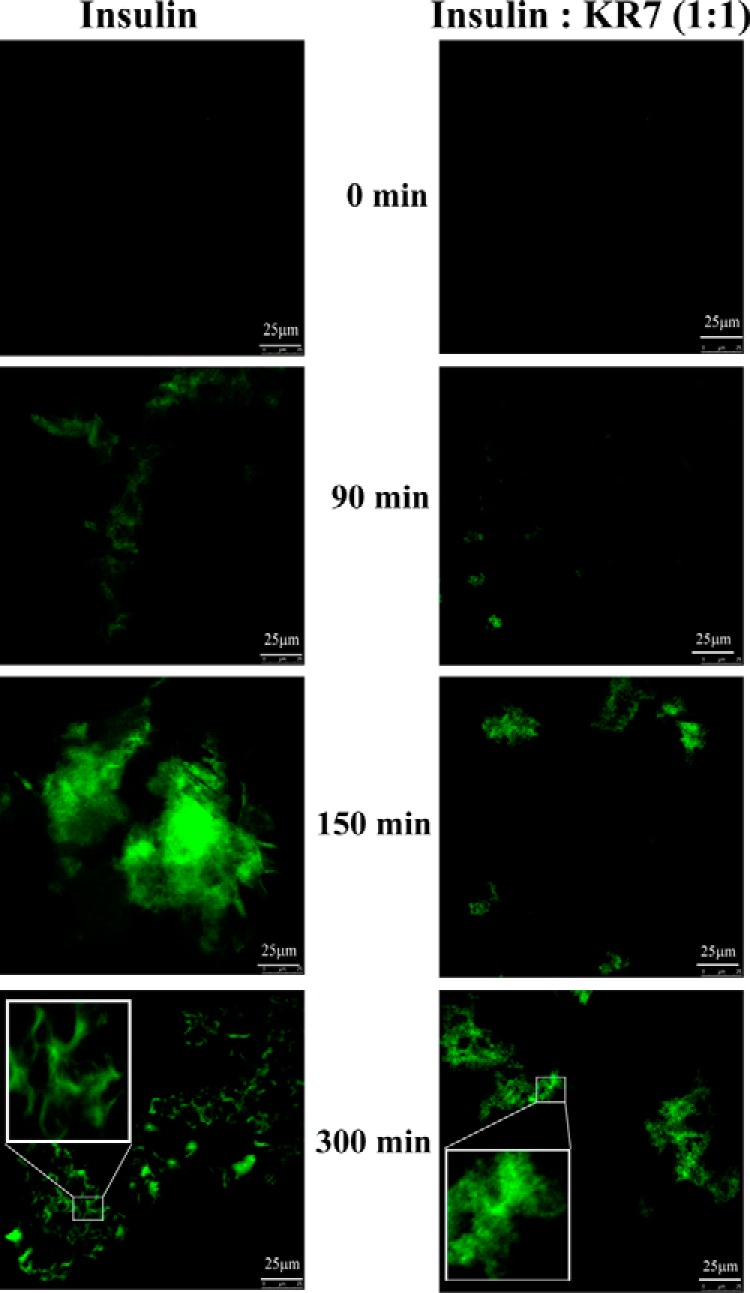
FIGURE 4.

Confocal images of insulin fibrillation by ThT fluorescence. Fluorescence confocal images of insulin amyloids recorded at time points indicated during the course of insulin fibrillation in the presence and absence of KR7 peptide. 10-μl aliquots of the reaction mixture from (2 mg/ml) stock samples were placed on clean glass slides and dried inside laminar airflow in dark at each time point. The inset displays the zoomed view of indicated region in square box. Insulin alone displays a curly fibrillar mass at 300 min in the presence of KR7 (1:1) exhibits amorphous aggregates after the same 300 min of aggregation time.
