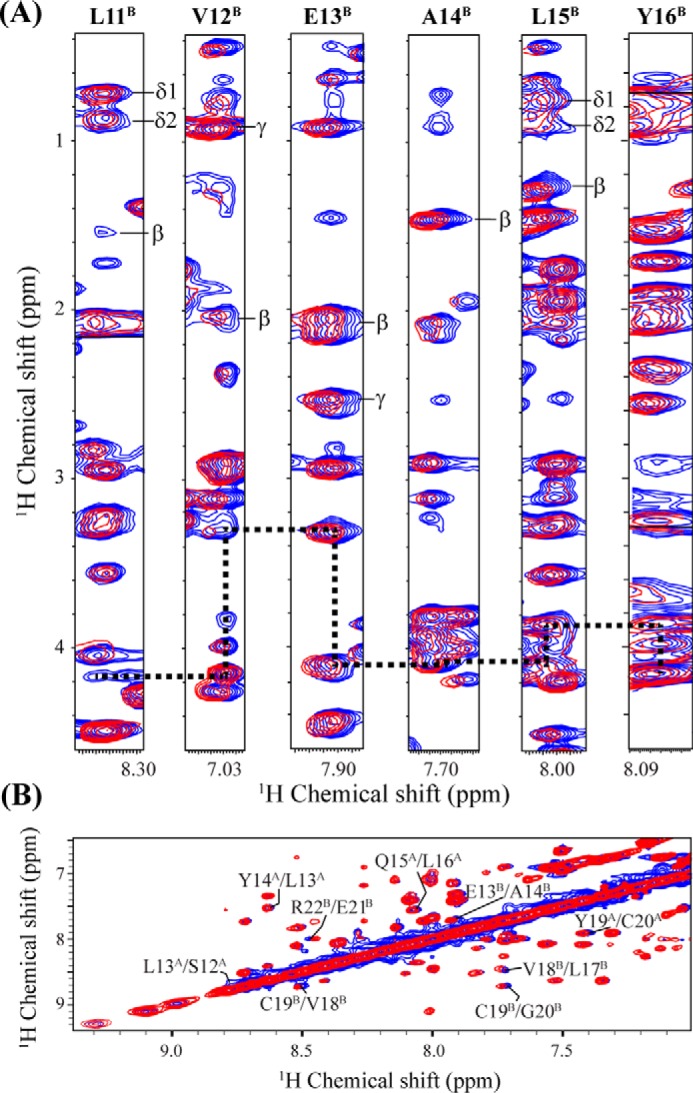
FIGURE 7.

NOESY spectra of insulin in 20% acetic acid. A, strip plot displaying the chemical shift perturbation as well as sequential connectivity (dotted black line) of insulin (chain B Leu-11 to Tyr-16) from the selected region of two-dimensional 1H,1H NOESY spectra of insulin in 20% acetic acid-d4, 10% D2O and at pH 1.9 in the presence (red contour) and absence (blue contour) of a equimolar ratio (1:1) of KR7 at 298 K using a Bruker Avance III 700 MHz spectrometer with a NOESY mixing time of 200 ms. B, amide region of the NOESY spectra of insulin showing the CSP (insulin residues and chain ID are indicated with number and in superscript, respectively) of insulin in the presence of KR7.
