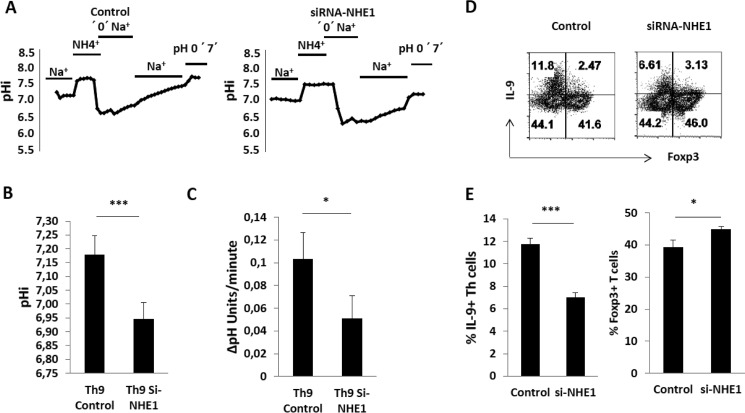
FIGURE 4.
Regulation of Th9 cells and iTregs development by NHE1. A, alterations of cytosolic pH (pHi) following an ammonium pulse in transfected Th9 cells with control and NHE1 siRNAs. Cells were loaded with H+ as described in the legend to Fig. 2A. Original tracings of typical experiments are shown for pHi measurement and Na+/H+ exchanger activity in Th cell subsets. B, arithmetic means ± S.E. (n = 3–5 independent experiments) of cytosolic pH prior to the ammonium pulse (pHi) in siRNA control and siRNA NHE1 Th9 cells. Asterisk (*) indicates a statistically significant difference (*, p < 0.05). C, arithmetic means ± S.E. (n = 3–5 independent experiments) of Na+-dependent recovery of cytosolic pH (ΔpH/min) in siRNA control and siRNA NHE1 Th9 cells. Asterisk (*) indicates a statistically significant difference (*, p < 0.05). D, differentiation of Th9 cells transfected with control and NHE1 siRNAs. At day 4, Th9 cells were activated with PMA, ionomycin, and brefeldin A for 4 h and stained for IL-9 and Foxp3. Representative FACS plots show the Th9 differentiation after knock-down of NHE1. E, arithmetic means ± S.E. (n = 3–5 independent experiments) of IL-9 and Foxp3 expression in siRNA control and siRNA NHE1 Th9 cells. Asterisk (*) indicates a statistically significant difference (***, p < 0.001; *, p < 0.05).

