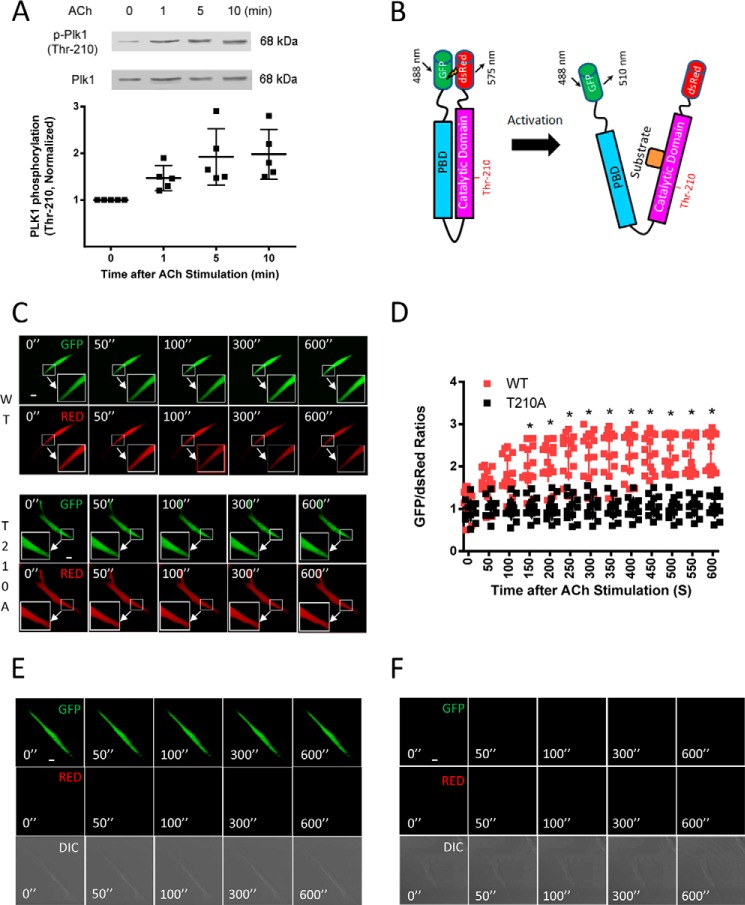
FIGURE 1.
Phosphorylation and activation of Plk1 in smooth muscle cells. A, smooth muscle cells were stimulated with ACh (10−4 m) for 1–10 min or left unstimulated. Plk1 phosphorylation at Thr-210 was evaluated by immunoblot analysis. Data are the mean values of experiments from five batches of cell culture. Error bars indicate S.D. B, schematic diagram of Plk1 biosensor. In inactive status, PBD binds to the catalytic domain forming a closed conformation. The closed conformation renders N-terminal DsRed and C-terminal GFP proximity, leading to high levels of FRET and lower GFP/DsRed ratios. Upon activation, Plk1 becomes an open conformation. The distance between the N-terminal DsRed and C-terminal GFP increases, which leads to low FRET signal and higher GFP/DsRed ratios. The open conformation facilitates the recruitment of substrate to the catalytic domain. C, representative images illustrating the effects of ACh stimulation (10−4 m) on emission of GFP and DsRed in HASM cells. The insets are the 4× magnification of the selected areas. WT, wild type Plk1; T210A, T210A Plk1; ”, seconds. D, stimulation with ACh increases the activity of WT Plk1 but not T210A Plk1. Ratios of GFP/DsRed fluorescence were determined for HASM cells in response to ACh stimulation (10−4 m). Increases in GFP/DsRed ratios indicate higher Plk1 activity. Data are the means ± S.D. (n = 15 cells from 4 batches of cell culture for WT Plk1 and 12 cells from 4 batches of cell culture for T210A Plk1). E, the GFP and DsRed emissions of cells expressing GFP-tagged Plk1 were evaluated using a confocal microscope. GFP emission was very high, whereas DsRed signal was not detected. In addition, ACh stimulation did not affect GFP/DsRed emission. Because no DsRed (RED) emission was detected, we failed to calculate the ratio of GFP/DsRed (n = 12 cells from 4 batches of cell culture). DIC, differential interference contrast. F, the emissions of GFP and DsRed of cells expressing DsRed-tagged construct were assessed. Neither GFP nor DsRed was found under the experimental conditions. ACh treatment did not affect the emission of GFP and DsRed. No GFP/DsRed ratios were calculated because of lack of fluorescent signals (n = 14 cells from 4 batches of cell culture). Scale bar: 10 μm.

