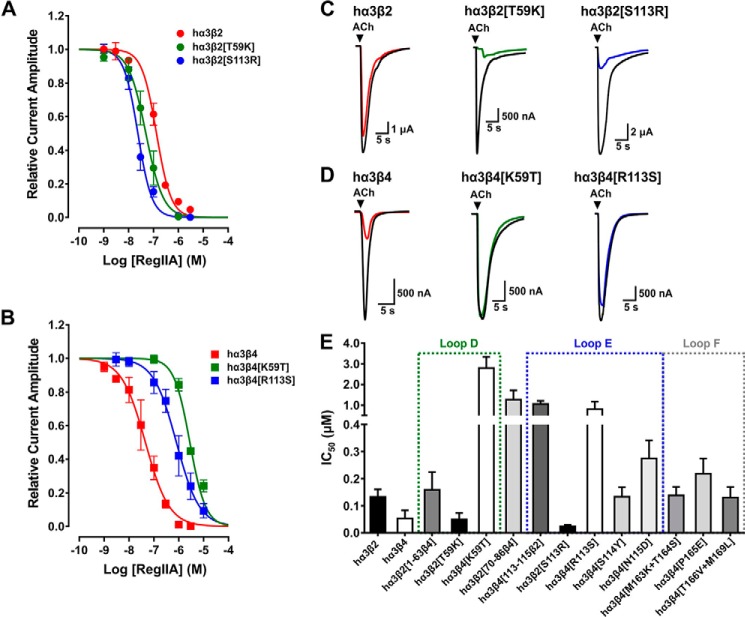
FIGURE 2.
The non-homologous residues at position 59 (Lys in hβ4, Thr in hβ2) and 113 (Arg in hβ4, Ser in hβ2) of the human β subunits are the key residues determining the selectivity profile in inhibitory potency of α-conotoxin RegIIA. A and B, concentration-response curves for RegIIA inhibition of wild-type and mutant human α3β2 (A) and α3β4 nAChRs (B). The two hα3β2 mutants exhibited a shift of the curve to the left compared with wild-type hα3β2 nAChR, indicating an increase in affinity to the peptide, whereas the opposite mutants of hα3β4 exhibited a lower affinity to RegIIA compared with wild-type hα3β4 nAChR. C, representative superimposed ACh-evoked currents obtained in the absence (control, black line) and presence of 100 nm RegIIA at wild-type hα3β2 (red), loop D mutant hα3β2[T59K] (green), and loop E mutant hα3β2[S113R] (blue). D, representative superimposed ACh-evoked currents obtained in the absence (control, black line) and presence of 100 nm RegIIA at wild-type (red) and mutant hα3β4 nAChRs (green and blue, respectively. E, bar graph summarizing the IC50 values with 95% CI obtained from concentration-response curves for RegIIA at wild-type hα3β2, hα3β4, and the mutants and chimeric subtypes analyzed. A gain in sensitivity was observed at mutants hα3β2[T59K] and hα3β2[S113R], whereas the most prominent reductions in sensitivity can be mapped to the opposite mutations hα3β4[K59T] and hα3β4[R113S]. Dotted squares indicate the agonist binding loops in which the respective mutants are located. All data points represent mean ± 95% CI. The IC50, 95% CI, and Hill slope (nH) values are summarized in Table 1.

