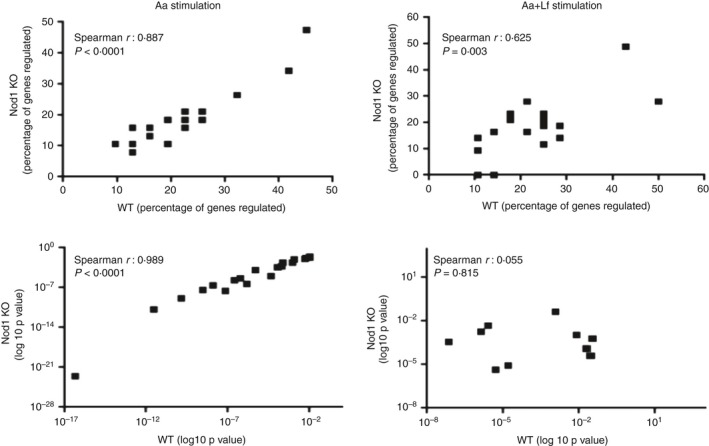
Figure 5.

Correlations of percentage of genes included in each functional annotation term and of the enrichment statistical values (log10 P value) obtained from DAVID Chart Reports. The correlation plots measure the annotation agreement between genes up‐regulated by heat‐killed Aggregatibacter actinomycetemcomitans (Aa) alone or associated with Gram‐positive Lactobacillus fermentum (Aa+Lf) stimulation in WT and NOD1‐deficient macrophages. The gene hit percentages and enrichment P values of top enriched terms between the lists of up‐regulated genes show very strong correlation upon Aa stimulation. The comparison of WT and NOD1‐deficient macrophages upon Aa+Lf stimulation shows a weak correlation between the percentage of genes up‐regulated and no correlation between the P values, indicating a qualitative difference in the response of NOD1‐deficient macrophages upon Gram‐negative and Gram‐positive stimulation.
