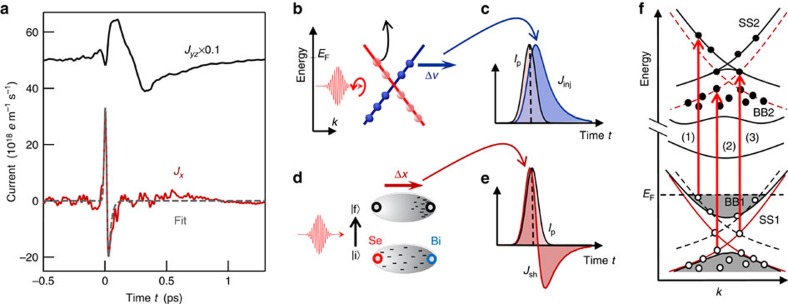
Figure 4. Extracted photocurrents and their assignment.
(a) Source currents of the two dominant signal components (see Fig. 3). The dynamics of these currents allow us to reveal the origin of the photocurrent. Curves are offset for clarity. (b) Example of an injection-type photocurrent. The pump pulse promotes electrons from the Dirac cone into other bands, thereby changing the electron band velocity. An asymmetric depopulation of the Dirac cone and, thus, nonzero net current is achieved by using circularly polarized light6. (c) Typical shape of the resulting photocurrent Jinj(t). Here, Ip(t) is the intensity envelope of the laser pulse. (d) Scenario of a shift photocurrent arising from an ultrafast transfer of electron density along the Se–Bi bond. (e) Typical bipolar temporal shape of the resulting sheet current Jsh(t). (f) Schematic of the electronic band structure of Bi2Se3. While BB1/BB2 represent bulk bands below/above the Fermi level EF, SS1/SS2 refer to surface states. Red arrows indicate three examples of pump-induced optical transitions (photon energy of ∼1.5 eV). To better illustrate the excitation process, thin black/red lines indicate copies of SS1/SS2 shifted upwards/downwards by the pump photon energy. Ground-state occupation is displayed shaded.

