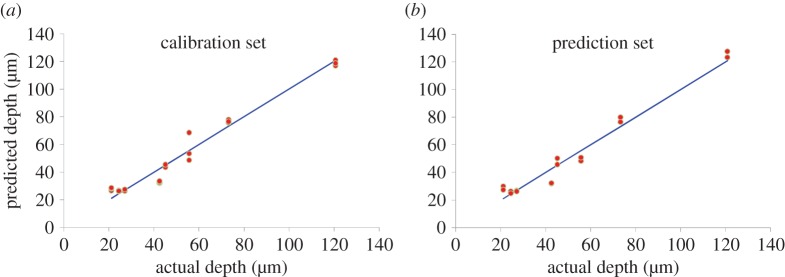
Figure 3.
(a) Calibration (R2 = 0.969, RMSEC—root mean square error of calibration = 5.46 µm) and (b) predicted thickness (R2 = 0.968, RMSEP—root mean square error of prediction = 5.84 µm) derived from non-invasive defocusing micro-SORS data at Δz = 500 µm using PLS analysis plotted as a function of thickness measured using optical microscopy on sample cross-sections. (Online version in colour.)

