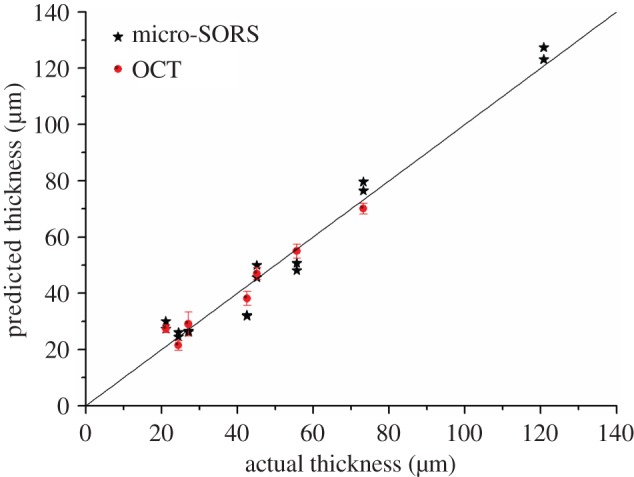
Figure 6.

Comparative OCT (R2 = 0.952, RMSEP = 4.30 µm) and defocusing micro-SORS predicted thicknesses plotted as a function of thickness measured using optical microscopy on sample cross-sections. (The straight line represents a 1 : 1 correspondence with optical measured thickness).
