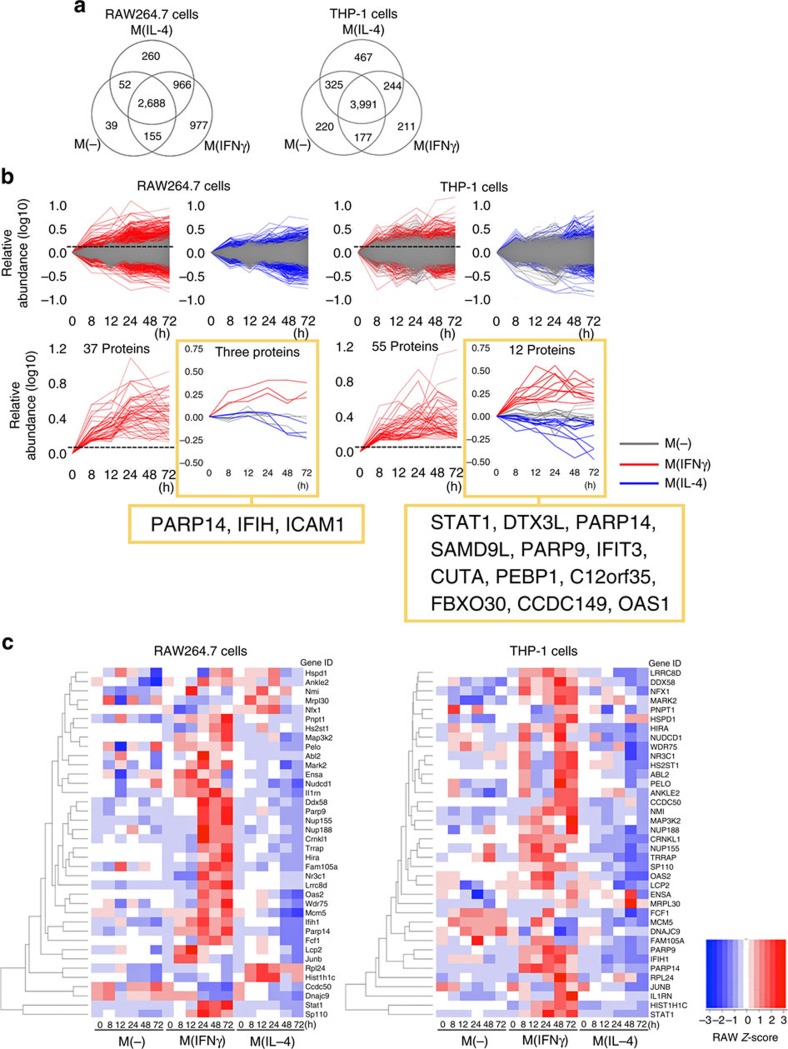
Figure 1. Bioinformatics to identify candidate regulators of macrophage activation.
(a) Venn diagrams showing the distribution of quantified proteins from mouse RAW264.7 and human THP-1 cells in unstimulated control, IFNγ-stimulated and IL-4-stimulated macrophages: M(-), M(IFNγ) and M(IL-4), respectively. (b) Data set-filtering strategy. Upper panels: superimposition of the 0-h-normalized protein abundance profiles for M(-) (grey traces) versus M(IFNγ) (red traces) or M(IL-4) (blue traces) data sets in RAW264.7 and THP-1 cells. Lower panels: extracted protein profiles of interest generated by data filtering. Red traces only graphs: extracted profiles of proteins whose abundances exceed the M(IFNγ) threshold (+0.13, maximum protein abundance in unstimulated control at 8 h, dashed line). From these M(IFNγ)-filtered traces, those that decreased in IL-4 stimulation when compared with their unstimulated control are plotted to the right for RAW264.7 and THP-1 cells, respectively. (c) Hierarchical clustering of 38 proteins from that were identified in both RAW264.7 and THP-1 data sets. Each row corresponds to a protein gene ID.

