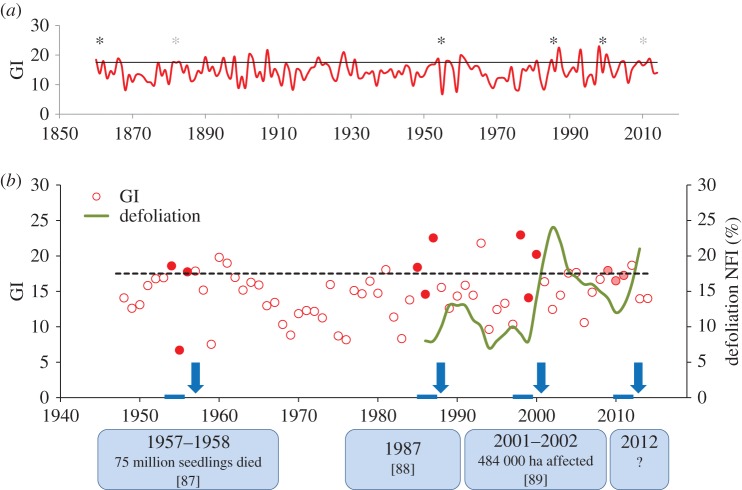
Figure 3.
(a) Gremmeniella index (GI) for central Sweden (Svealand, SMHI Swedish Meteorological and Hydrological Institute) between 1860 and 2015. The mm of rainfall during June–August for the year divided by the average temperature in degrees above 0°C was used to calculate the index, following the method described in Hansson & Karlman [75]. A solid grey line representing 17.5 on the GI indicates higher than normal values. Black asterisks indicate years following a reinforcement of the risk of infection, which happens in the second year of conditions conducive for Gremmeniella infection since sporulation peaks 2 years after a first outbreak. Grey asterisks indicate the periods when the GI was over 17.2. Between 1860 and 2015, six such high-risk years occurred in this area, more frequently in recent times. (b) The GI for central Sweden (Svealand, SMHI Swedish Meteorological and Hydrological Institute) between 1945 and 2015 linked to major G. abietina epidemics [84–86]. A dashed black line representing 17.5 on the GI indicates higher than normal values. Red and pale-red dots indicate the period when conditions conducive for infection occurred (GI > 17.5 and GI > 17.2, respectively). The green line indicates the average needle loss in pine trees in the same region as determined from the National Forest Inventory (NFI). Blue arrows indicate the year after a two year period of inciting and reinforcement of Gremmeniella attack, and the blue boxes include information on documented major outbreaks of the disease. Peaks in needle loss coincide with reports of major G. abietina epidemics at the local scale. GI was above 17.2 in 2010 and 2011, and even though no major outbreaks were reported, a needle loss peak was also found, suggesting that a mild G. abietina epidemic may have struck central Sweden during this period [87–89].

