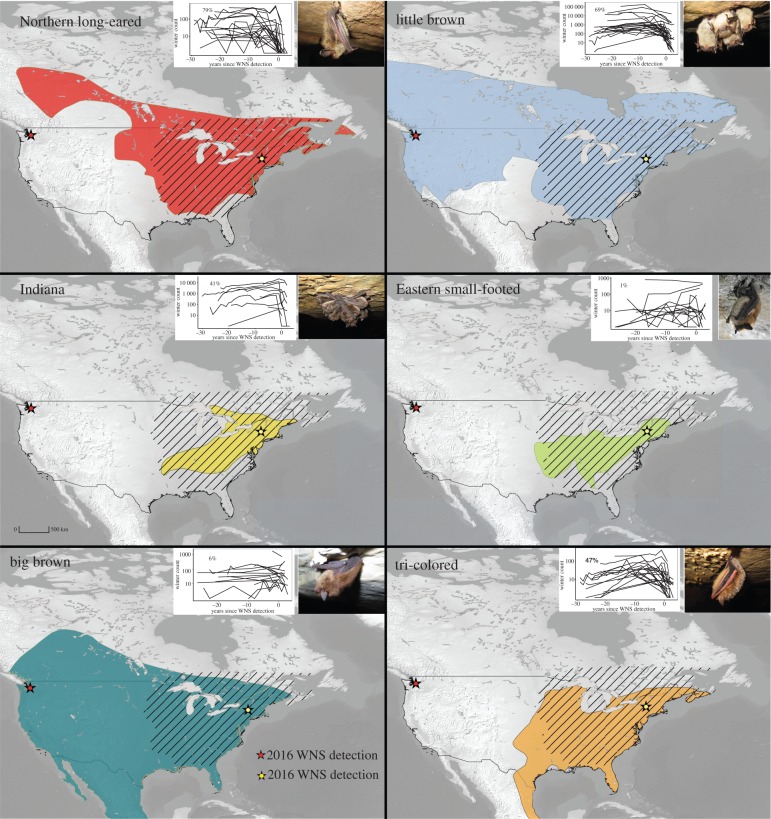
Figure 1.
The distribution of white-nose syndrome (hatched) as of March 2016, and distribution maps for six hibernating bat species (colours) in the USA and Canada. Inset: Counts of hibernating bats at sites from 1979 to 2011, with per cent declines in the first year of WNS detection indicated in the upper left of the graph.

