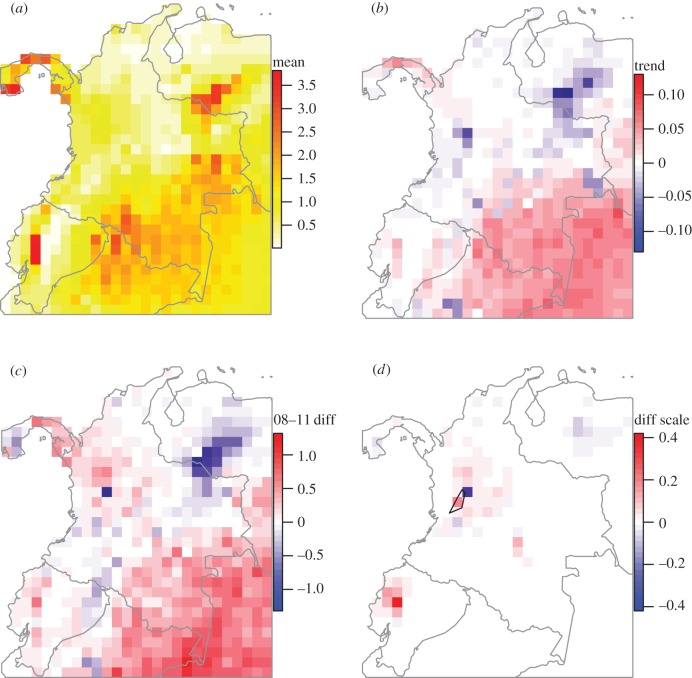
Figure 5.
ROI infection risk. (a) Mean daily infection risk per pixel, 1990–2015. (b) Annual trend in mean daily infection risk 1990–2015. (c) Difference in mean daily infection risk between 2008 and 2011 and remaining years. (d) Difference in mean daily infection risk between 2008 and 2011 and remaining years, scaled by coffee area per pixel to visualize change in coffee-producing regions. The blue polygon encompasses the six UNESCO World Heritage Site areas within the Coffee Cultural Landscape of Colombia.

