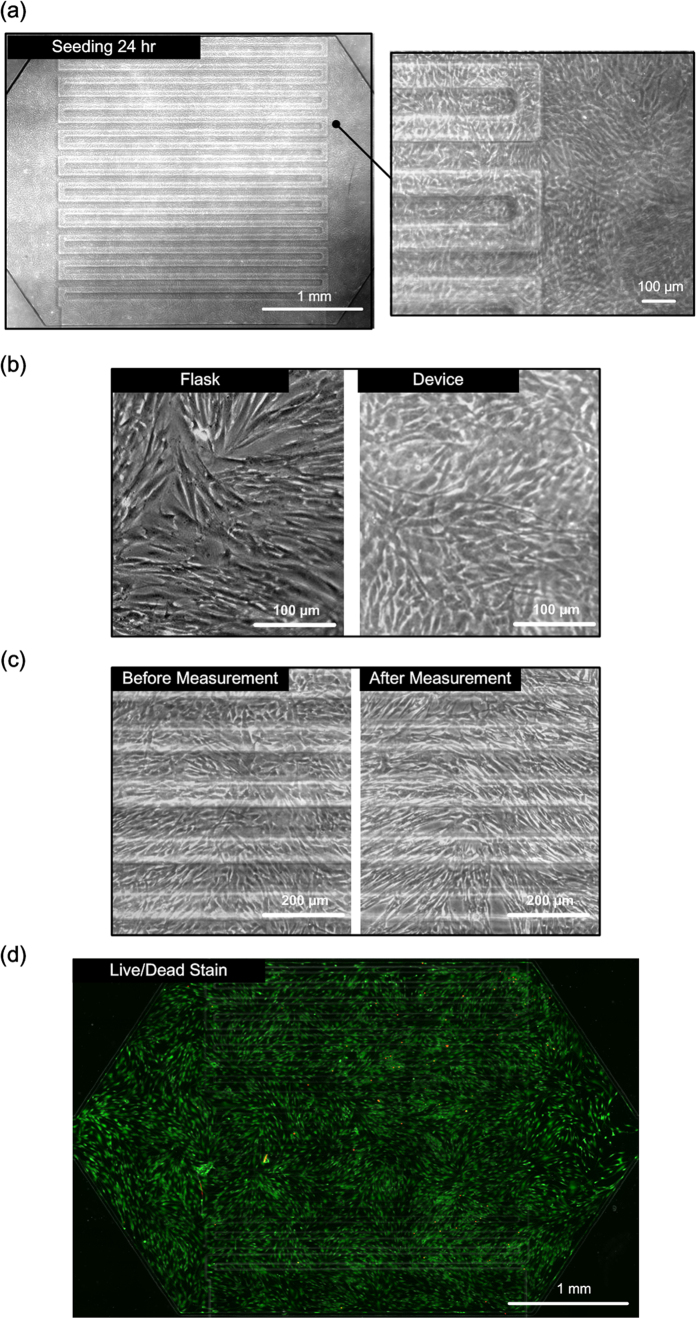
Figure 4.
(a) Bright field phase images of MRC-5 cells cultured in the microfluidic device for 24 hours. (b) Comparison between MRC-5 cells cultured in a T25 flask and in a microfluidic device. (c) Cell morphologies before and after the in-plane elasticity measurements. (d) Fluorescence image (live/dead stain) of MRC-5 cells cultured in the device after the in-plane elasticity measurement. Live cells show green fluorescence, and dead cells show red fluorescence.

