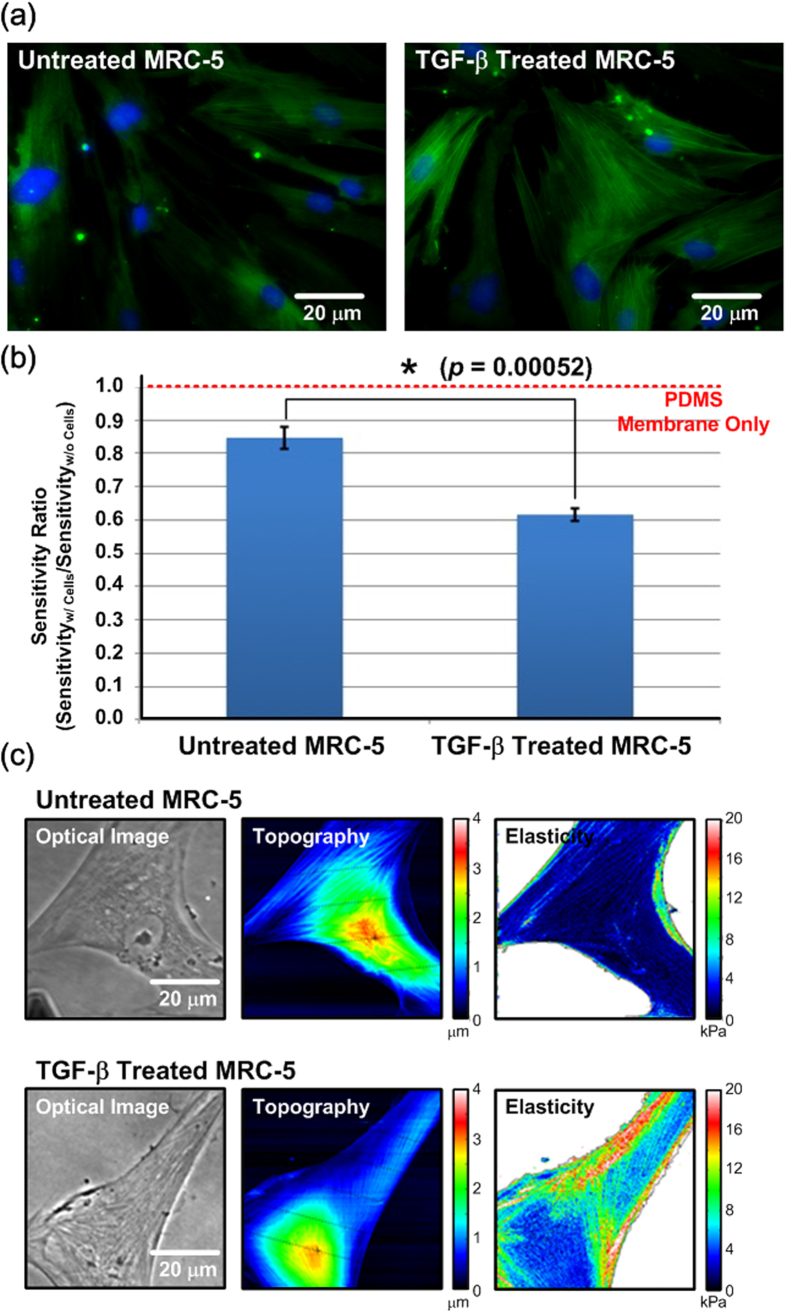
Figure 6.
(a) Fluorescence images of untreated and TGF-β treated MRC-5 cells (Green: α-SMA; Blue: nuclei). (b) Average sensitivity ratios (sensitivitywith cell/sensitivitywithout cell) of the embedded pressure sensors when culturing untreated and TGF-β treated MRC-5 cells in the microfluidic devices. Data are expressed as mean ± sd (n = 3). (c) Topography and elasticity of untreated and TGF-β treated MRC-5 cells measured using AFM.

