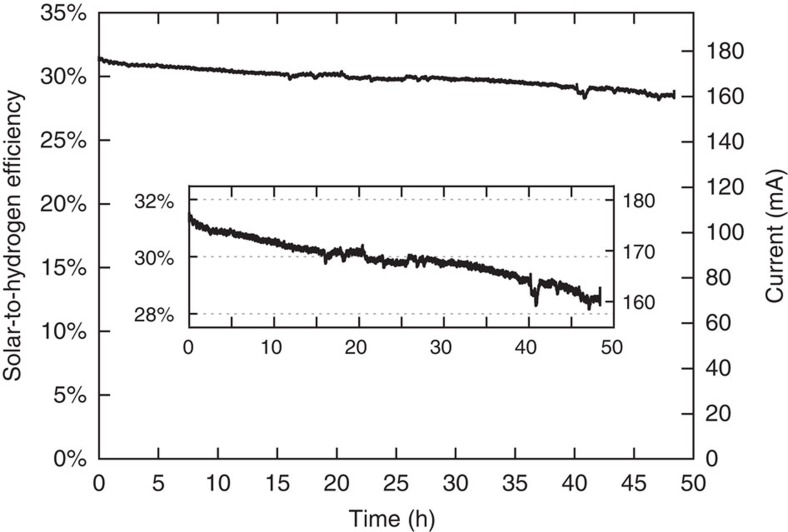
Figure 4. STH efficiency.
The STH efficiency of the PV-electrolysis system was measured over a 48 h continuous operation. The right vertical axis shows the current passing through the dual electrolyser and the left vertical axis shows the corresponding STH efficiency. The inset highlights a smaller y axis range for improved clarity.

