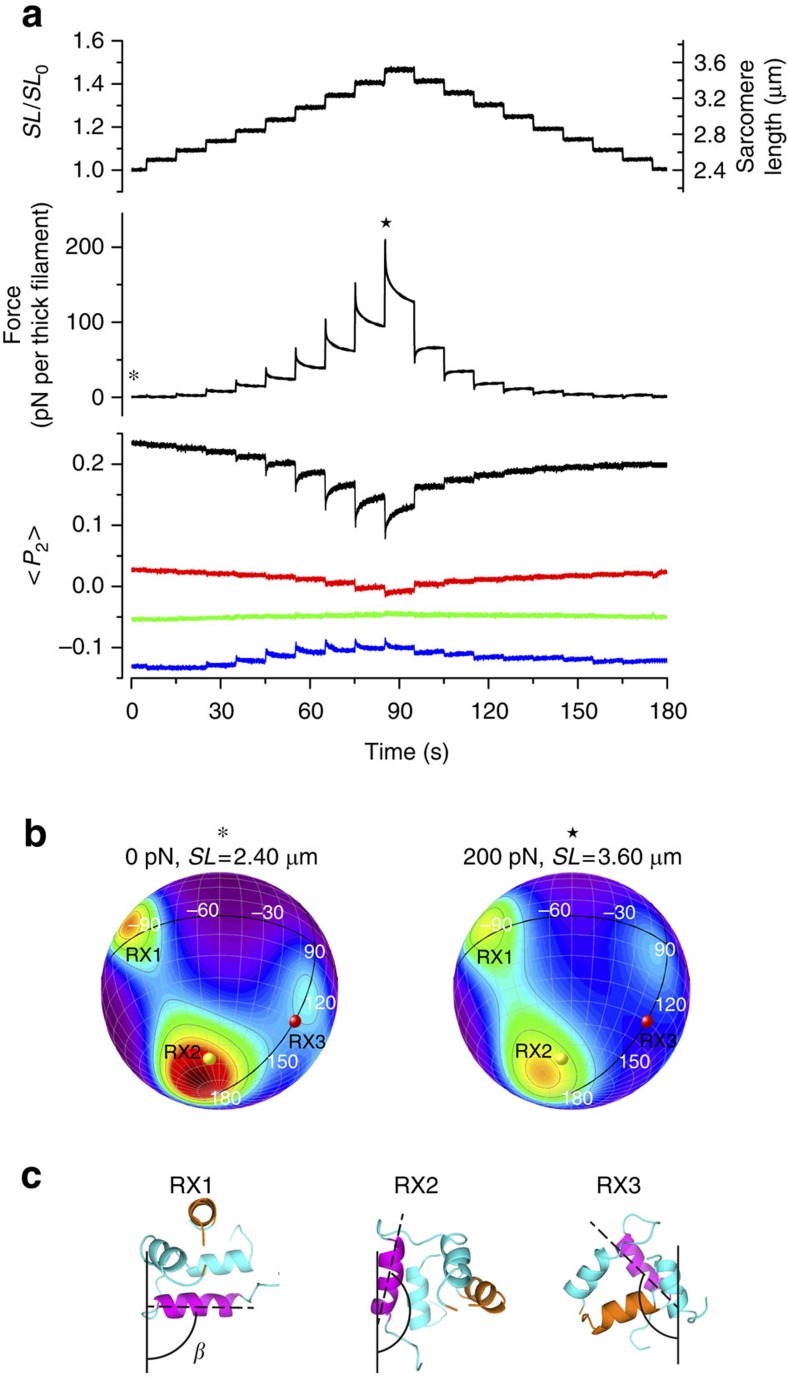
Figure 1. Stress-induced changes in the orientation of the RLC-C-lobe in relaxed muscle.
(a) Sarcomere length change, estimated from total fluorescence intensity (see Supplementary Methods and Supplementary Fig. 1) (SL0=2.40 μm), passive force and <P2> for four RLC probes7 (E-probe, black; FG-probe, red; H-probe, green; G-probe, blue) recorded during a staircase of stretches and releases applied to a relaxed muscle fibre at 25 °C in the presence of 5% Dextran. (b) Maximum entropy (ME) spherical contour plots of the probability distribution of RLC C-lobe orientations at 0 (asterisk) and 200 pN (star; see text for details); red and yellow spheres denote the orientations determined by electron microscopy of isolated thick filaments (3DTP6). (c) Graphical representations of RLC C-lobe orientations RX1-3 from b with respect to the filament axis (black vertical line), with E and G helices in magenta and orange, respectively (see also Supplementary Fig. 6 of Fusi et al.7 for comparison with RLC orientations in 3DTP).

