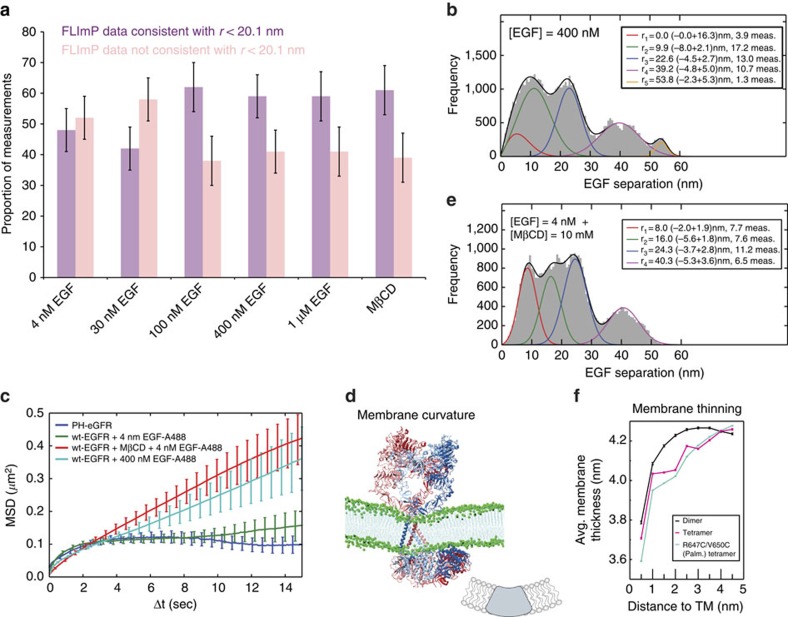
Figure 6. Membrane bending and EGFR oligomerization.
(a) Percentage of separations whose 69% confidence intervals overlap with the dimer/tetramer range (r<20.1 nm) or do not (r> 20.1 nm), estimated by the ratio of the integral area of interest (purple or salmon in FLImP distributions, Supplementary Fig. 7) to the integral area of the distribution. (b) FLImP distribution (grey) of pairwise separations of fluorophore-conjugated EGF on CHO cells expressing ∼105 copies of wild-type EGFR treated with 400 nM EGF (46 measurements). The distribution is fitted (black line) with a sum of five Rician peaks (colour lines). Best-fit positions and error bars shown in the inset. (c) (green) MSD plot from single-particle tracks of wild-type EGFR complexes on live CHO cells at 37 °C labelled with Alexa 488-conjugated EGF; (dark blue) MSD plot from single-particle tracks of PIP2 labelled with a PLCδ1-Pleckstrin homology (PH) domain (PH-eGFP) fusion construct which specifically binds PiP2 (ref. 75), transfected on CHO cells expressing wild-type EGFR. MSD plots include data from ∼>103 tracks and three biological repeats. Bootstrap-estimated errors (vertical line) are shown. Linear MSD plots suggest Brownian motion; concave-down MSD plots suggest confinement at the plasma membrane76. (d) The negative curvature of the membrane local to an EGFR tetramer in simulation. The cartoon illustrates the membrane-bending effect of the N-terminal dimers of EGFR transmembrane helices as a hydrophobic wedge. (e) FLImP distribution (grey) of pairwise separations of fluorophore-conjugated EGF on the surface of CHO cells expressing ∼105 copies of wild-type EGFR pre-treated with 10 mM MβCD, exposed to 4 nM EGF (33 measurements). Best-fit positions and error bars are shown in the inset. (f) Membrane thickness (Y-axis) as a function of distance to the transmembrane helices (X-axis) in simulations of the wild-type active dimer and tetramer, and the palmitoylated R647C/V650C tetramer. The membrane thickness is indicated by the average separation between the two sheets of phosphorus atoms of the two lipid layers. The wild-type tetramer (red line) exhibited a more pronounced membrane-thinning effect. The data are plotted as averages and standard error of the mean over frames of the simulations.

