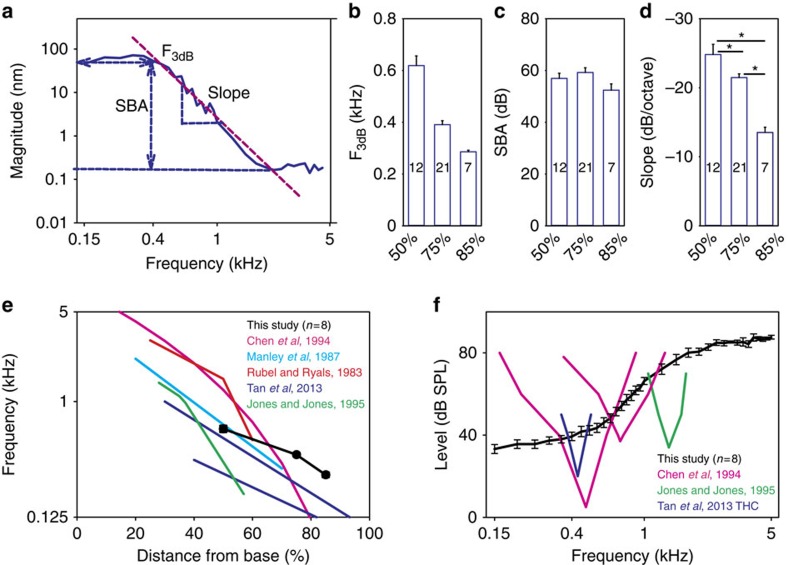
Figure 3. Mechanical responses do not match hair cell and auditory nerve responses.
(a) The vibratory responses were fit with a low-pass filter model to calculate the corner frequency (F3db,b), the stop-band attenuation (SBA, c), and the filter slope (slope, d). (e) The tonotopic map we estimate using the corner frequencies was similar to previously published maps of the chicken basilar papilla. (f) The sound level needed to produce a 30 nm magnitude vibration at the 75% location was not tuned, unlike the threshold plots from previously published measurements in auditory nerve fibres and hair cells. Error bars show the s.e.m. Asterisks in d represent statistical significance *P<0.05.

