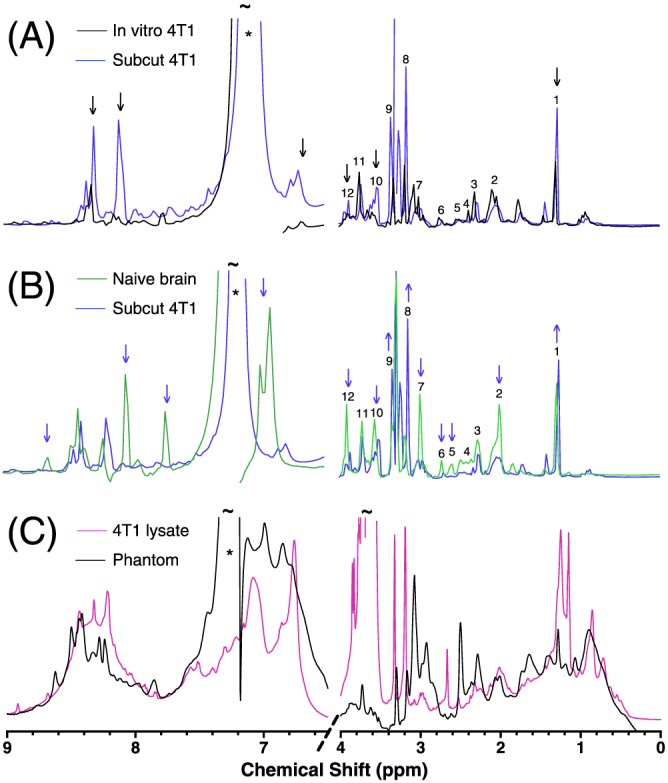
Figure 1.

One‐dimensional 1H NMR spectra, showing (A), the metabolic similarity of 4T1‐GFP cells grown in vivo as a subcutaneous tumour ( ) or in vitro (
 ) in culture flasks, (B), the metabolic distinctness of 4T1‐GFP mouse mammary carcinoma cells (
 ) from naïve mouse brain (
 ) and (C), the similarity of the broad line shape component of the spectrum from cell lysate of 4T1‐GFP cells (
 ) to the PCA extract of the same cell line supplemented with 8% w/v BSA (
 ). Coloured arrows signify relative differences between spectra, and * signifies signal from a contaminant from the PCA extraction procedure. ~ signifies points where the peaks exceed the axis limits. Numbers are metabolite identification: 1, Lac; 2, NAA; 3, Glu; 4, Gln; 5, NAA; 6, Asp; 7, Cr/PCr; 8, PC/GPC; 9, Tau; 10, Myo‐ins; 11, Asc/Gln/Glu/GSH; 12, Cr/PCr
