
Figure 2.
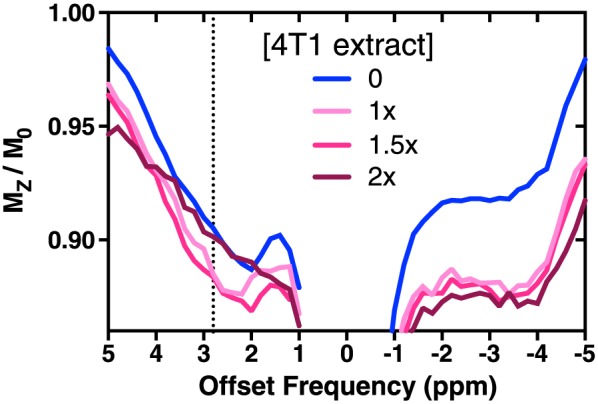
Z spectra of 8% w/v BSA phantoms at pH 7.2 supplemented with PCA extract from 4T1‐GFP cells, replicating metabolite concentrations of 1×, 1.5× or 2× intracellular levels. The 4T1‐GFP intracellular metabolites clearly alter the measured Z spectrum from the BSA‐only Z spectrum (0×). The CEST effect at 2.8 ppm broadens with increasing metabolite content, consistent with an increasing average chemical exchange rate