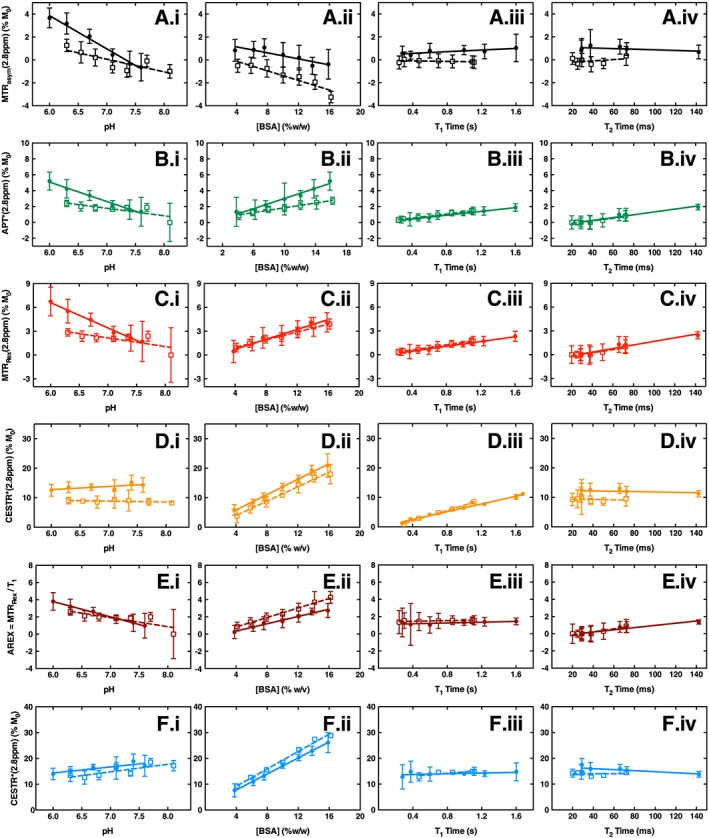
Figure 3.

Linear regression relationships of MTRasym A, APT* B, MTRRex C, CESTR* calculated with default T 1/T 2 priors D, AREX E, and CESTR* calculated with measured T 1/T 2 priors F, as a function of pH (i), BSA content (ii), T 1 time (iii) and T 2 time (iv) for the CEST effect at 2.8 ppm in phantoms containing 8% w/v BSA and PCA extract from 4T1‐GFP cells (solid circles) and naïve mouse brains (open squares). Solid and dashed lines are the fitted linear regression relationships to tumour and naïve brain phantoms, respectively
