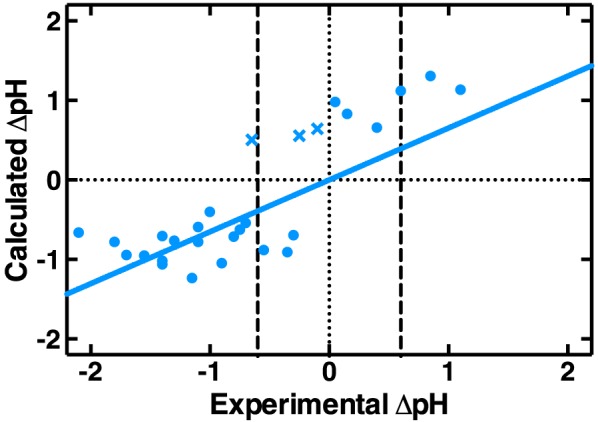
Figure 5.

Correlation between ΔpH calculated using a rearrangement of Equation (6) for statistically significant ΔCESTR* measurements between phantoms, and the ΔpH experimentally measured by pH probe. The R 2 value is 0.61. Cross markers (X) indicate the data points where CESTR* incorrectly predicted the sign of the pH change
