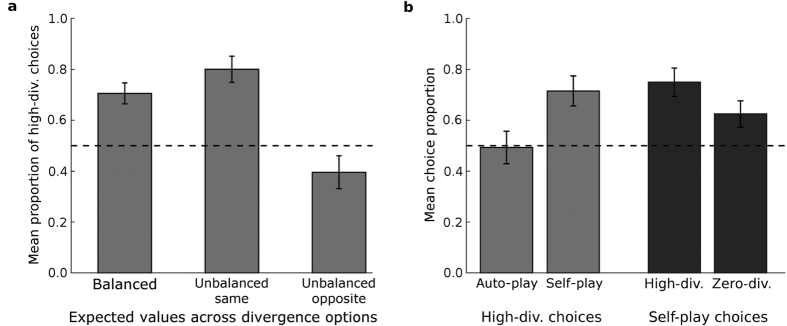
Figure 3. Mean choice proportions in Experiments 1 and 2.
Dashed lines indicate chance performance. Error bars = SEM. (a) Mean proportions of high- over zero-divergence choices, for blocks in which expected values were identical across high- and low-divergence options (Balanced), blocks in which expected values differed across options in the same direction as divergence (Unbalanced same) and blocks in which expected values differed in the opposite direction of divergence (Unbalanced opposite), in Experiment 1. (b) Mean proportions of high- over zero-divergence choices (left) for blocks in which the high-divergence option was Auto-play versus blocks in which the high-divergence option was Self-play, and mean proportions of self- over auto-play choices (right) for blocks in which both options had high-divergence (High-div.) versus blocks in which both options had zero-divergence (Zero-div.), in Experiment 2.

