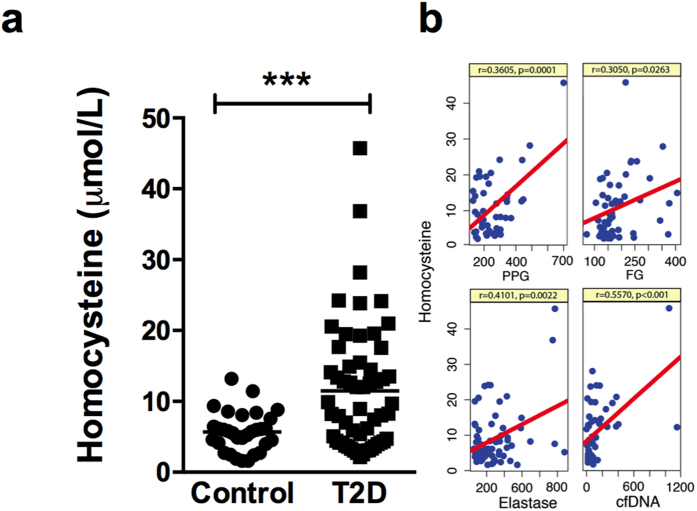
Figure 3. Plasma homocysteine levels are elevated in T2D and positively correlate with components of NETs.
(a) Plasma homocysteine levels were measured in control (n = 31) and T2D (n = 57) subjects. Data are represented as scatter plots ± SEM and significant changes between control and T2D subjects are represented as ***p < 0.001. (b) Linear correlation plots between homocysteine and either with postprandial glucose; fasting glucose; elastase or cfDNA are shown. Pearson’s coefficient and p values are mentioned within the box.

