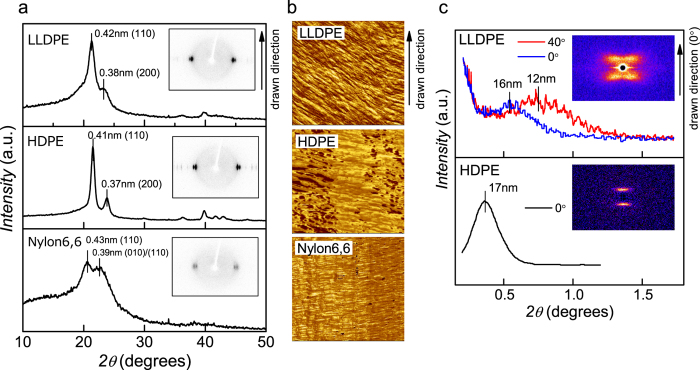
Figure 3. Nanostructure analysis of drawn fibres.
(a) WAXD peak profiles taken from the equatorial line of the inset WAXD images. (b) AFM phase images (1 μm × 1 μm) of cross-sectional surface of the drawn fibres cut along the fibre axis. The dark and light areas correspond to harder and softer parts of the fibrils, respectively. (c) Peak profiles of SAXS of the drawn LLDPE and HDPE lines. The angle of the peak profile is defined according to the drawn direction. Insets show SAXS images.

