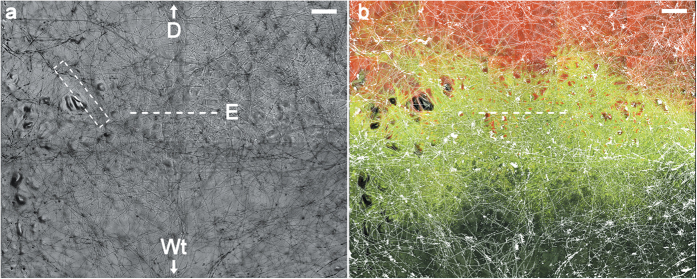
Figure 2. Localisation of Pseudomonas putida transconjugants in systems with mycelial networks.
(a) Transmission light image of agar surface with mycelial network of P. ultimum. White arrows indicate inoculation points of P. putida KT2440 wildtype-strain (Wt) and KT2442 donor-strain (D) in a distance of 7 mm on the established mycelial network. Zone in the dashed white box was used as an input for the simulation model in Fig. 4a. The dashed white line represents the equal distance between both inoculation points (E). (b) Combined image of red and green fluorescence channels with an overlay of the mycelial structure shown in white. Transconjugants can be seen emerging along the network structures. Scale bars represent 500 μm. Images were taken 3 days after incubation.

