
Figure 3. Relative amount of transconjugants in the microcosm setups after 3 days of incubation (n = 6).
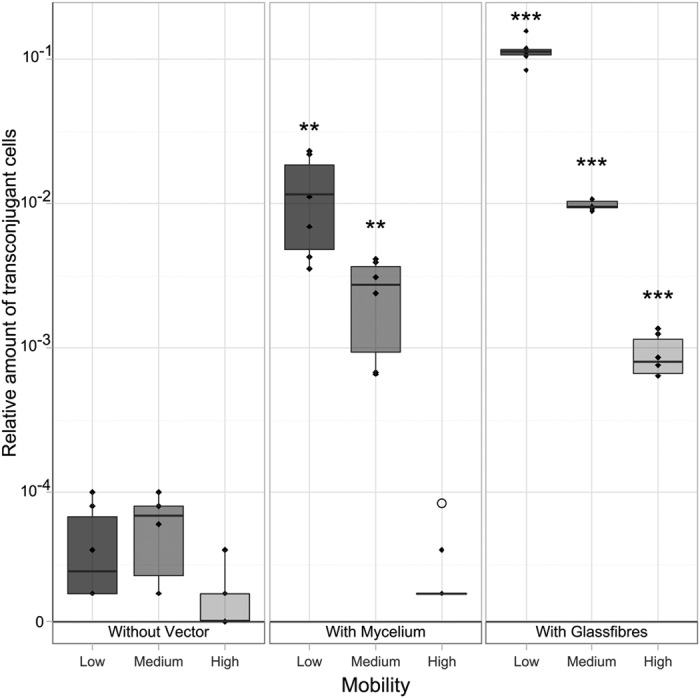
Diamonds represent single data points; black lines show arithmetic mean, grey boxes show upper and lower quartile. Removal of outliers detected with Grubbs’ test (α = 0.05) shown as circle. Absolute zero values shown as “0” in the otherwise logarithmic scale. Significant differences to respective systems without vectors were determined by Students’ t-test. (**p < 0.01; ***p < 0.001).