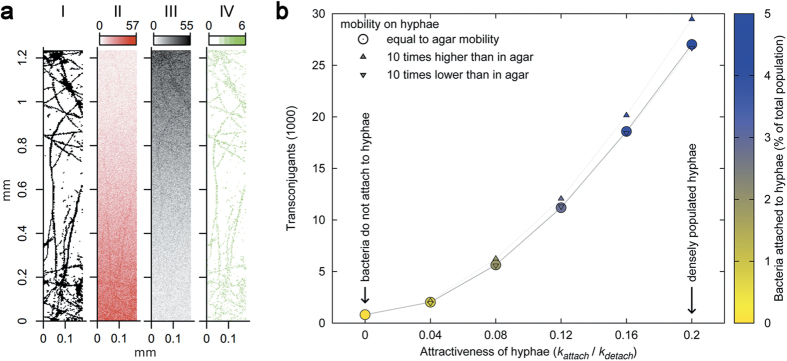
Figure 4.
Simulation results of (a) the spatial distribution of transconjugants and (b) the role of hyphal attractiveness on conjugation rate in low mobility systems with mycelia. (a) hyphal network used in the simulation model (derived from a microscopic image, see Fig. 2a) (I), simulated distribution of donor (II) and recipient (III) cell numbers, and cumulative spatial distribution of conjugation events (IV) after 2.5 minutes of simulated time (halfway through total simulation time). Parameter values were Dagar = Dhyphae = 1.5 × 10⁻⁵ cm2/s, kattach = 0.1 s−1, kdetach = 0.5 s−1. (b) simulated number of transconjugants after 5 minutes of simulation time for different attractiveness levels of hyphae for bacteria. Attractiveness levels of hyphae (defined by changing kattach while keeping kdetach = 0.5 s−1) ranged from low attractiveness, as in high mobility agar systems where bacterial mobility was unhindered, to high attractiveness systems, such as low mobility agar, in which the bacteria had to rely on mycelial networks to explore the system. As attractiveness increases more bacteria populated the hyphal network (color) and more conjugation events occured. Cases in which hyphal networks hindered (▼) or promoted bacterial mobility (▲) had only a minor impact. Dagar was set to 1.5 × 10⁻⁵ cm2/s.

